
Assortment & Pricing — Territorial Intelligence
DISTRIBUTION IS ALL YOURS.
OWN IT BEFORE THE MARKET DOES IT FOR YOU.
Flipflow transforms your distribution into a structured layer of real-time territorial intelligence.
Stop guessing where your brand is losing ground and turn every territory into a measurable opportunity. Visualise the actual product range by store and postcode, identify gaps compared to the competition, and prioritise your resources where the impact on revenue is greatest.
Designed for:
Trade Marketing
Category Management
Sales Management

You have the data. What you lack is structural visibility.
Sell-in, aggregate sales, regular audits, national reports. The major operators already have all of that. And yet they rarely know exactly:
The problem isn’t a lack of information. It’s the lack of a framework to turn that information into coordinated regional decisions. Relying on static audits or business intuition means losing ground. Whilst others react to past trends, you need to lead the way in the present.
How we solve this at flipflow
Structured, actionable and comparable territorial intelligence
Flipflow builds a comprehensive map of your product range and that of your competitors: retailer by retailer, category by category, postcode by postcode. Not just a snapshot. But a layer of intelligence that’s always active.


Related blog posts


Economic impact
A twofold benefit: structural savings + growth in distribution
In large organisations, the traditional model involves:
Flipflow changes two variables at the same time:


A paradigm shift
| From traditional management… | To intelligence with flipflow |
|---|---|
| Regular audits | Continuous visibility |
| Partial coverage | Consistent coverage |
| Weeks-long lag | Early warnings |
| Subjective prioritisation | Prioritisation by impact on revenue |
| Delayed response | Coordinated action |
Also for manufacturers and private labels
Category-level structural intelligence for manufacturers
This module is not only essential for brands with physical retail outlets.
For private-label manufacturers and product development, it enables:
Thanks to advanced standardisation (Elodin), each SKU is classified by technical attributes, ingredients, formats and market segments.
This makes the module a tool for structural category intelligence, not just regional execution.

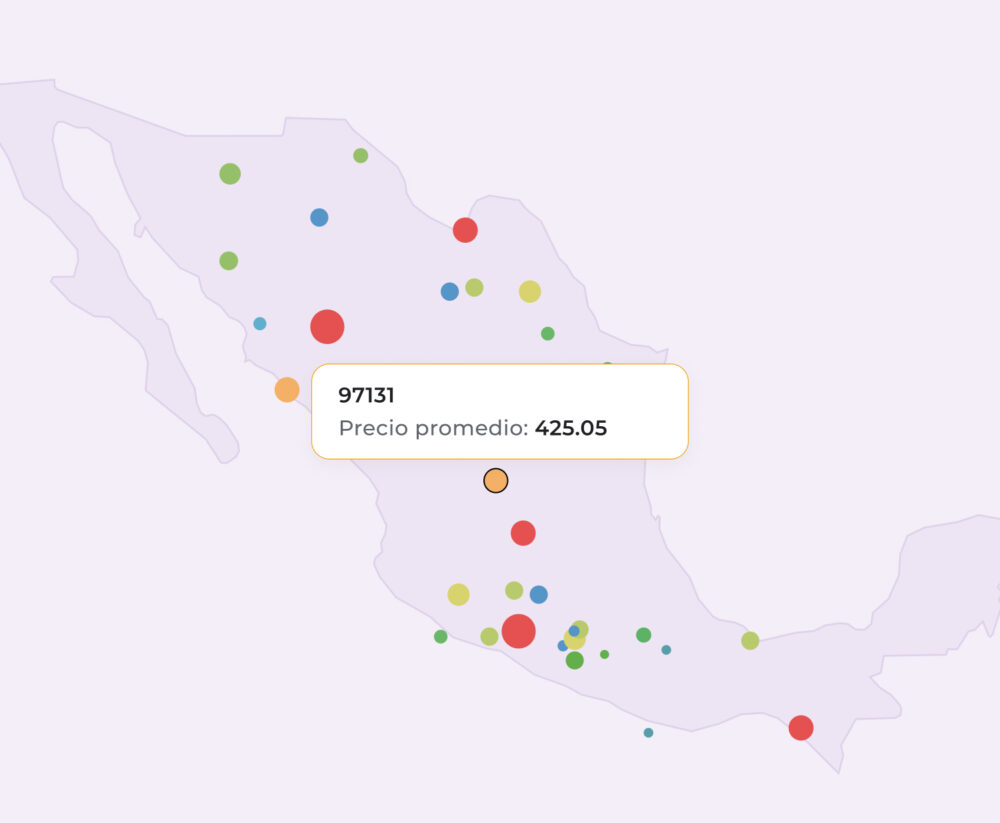
Case Study | Retail | Food & Beverages
Monitoring of distribution by store and brand image throughout Mexico
The Mexican group, a global leader in the dairy sector, optimises store checks, monitors prices and stock levels, and improves visibility, with its entire team aligned.
+9%
INCREASE IN ON-OFF SELL-OUT
-65%
COST OF STORE CHECKS AND MARKET REPORTS
-68%
EXPENDITURE ON DATA ANALYSIS
Integration with the other modules
Territorial intelligence is a component of the system

Assortment & Territorial Intelligence integrates with:
Digital Shelf Intelligence
Online visibility aligned with physical distribution.
Designed for: marketing, e-commerce and retail media teams.
Pricing & Seller Control
Alignment between regional product range and pricing strategy.
Designed for: revenue, trade marketing, marketplace, pricing and sales management teams.
Customer Sentiment Intelligence
Consumer perception linked to actual availability.
Designed for: consumer insights, marketing, e-commerce and product teams.

And above all, with…
Tyrell AI
Automatic prioritisation of territories
Commercial risk detection
Weekly executive summary
Flipflow is not a standalone module. It is a coordinated architecture.
Flipflow is not a standalone module. It is a coordinated architecture.

Distribution is not a KPI.
It is a market structure.
And structure isn’t something you can improvise.
Flipflow turns your territorial coverage into an advantage that is designed, measured and protected week by week.