Territorial Intelligence in Retail: Opportunity Mapping by Postcode and Commercial Prioritisation
TL;DR
Territorial intelligence allows for identifying where the true commercial opportunity lies by crossing potential, performance, coverage and competition at the postcode level. The opportunity map turns data into decisions, helping to prioritise resources and maximise commercial impact.
Introduction: The End of the “One-Size-Fits-All” Strategy
For years, many retail organisations have made commercial decisions by applying uniform criteria to radically different territories. The same planogram for Madrid as for Murcia. A single product mix in a high-income neighbourhood and in a peripheral area. The same commercial effort in a saturated market as in one with untapped potential.
This logic has an understandable explanation: it simplifies operations, reduces analysis effort and facilitates standardisation. But it has a silent and cumulative cost. Resources are distributed without discrimination, opportunities are diluted and problems are camouflaged in averages that lie.
Modern retail demands another way of thinking about territory. A way that starts from granular data, identifies where real potential exists and guides commercial decisions with surgical precision. That way has a name: territorial intelligence. And its central tool is the postcode opportunity map.
What is a Postcode Opportunity Map?
A postcode opportunity map is an analytical visualisation that represents the commercial potential of each area and allows it to be compared with current performance. Its utility is based on answering very specific questions:
- Where is there more potential demand for my category?
- In which areas am I below what I could be selling?
- Which territories have room for improvement in distribution, assortment or price?
- Where should commercial resources be concentrated?
The key is not to limit oneself to simply plotting sales on a map. A good territorial analysis crosses several layers of information: market size, sociodemographic profile, current performance, presence of competitors, point-of-sale coverage, and assortment and pricing variables.
This logic connects with decades of geographical analysis applied to retail. Reilly already proposed in 1931 that commercial attraction depends on mass and distance, and Huff developed a model in 1964 to estimate commercial areas of influence. Today, with more data and better tools, that foundation can be applied to daily sales, trade marketing and expansion decisions.
Unlike conventional sales analyses, which look inwards, the opportunity map looks outwards. It compares what the business is capturing with what the market could offer. That gap, when it exists, defines the opportunity.
Why is the Postcode a Useful Unit in Retail?
A municipality is too large. An individual point of sale, too small. The postcode fits well in that middle ground where commercial decisions actually materialise. It has a sufficient level of detail to locate opportunities without falling into unmanageable fragmentation. Furthermore, it connects well with field decisions: commercial routes, resource allocation, local campaigns, focus by fascia and point-of-sale network analysis.
Its utility is supported by several advantages:
- Allows for moving from regional aggregates to micro-territories.
- Facilitates comparing similar areas with each other.
- Detects pockets of underserved demand.
- Improves the allocation of commercial and promotional efforts.
Public sources also reinforce this approach. The INE (National Statistics Institute) offers data on population, income and demographic characteristics that can be approximated or related to specific territories. Eurostat provides comparable indicators on population density, urbanisation and disposable income. These layers help estimate the potential demand by area.
For example, within the same city, two postcodes can differ substantially in average disposable income, household density, age profile or presence of competitors. Treating them the same is ignoring information that already exists and which, when incorporated into the analysis, completely changes priorities.
From an operational point of view, the postcode also has practical advantages. CRM systems and sales receipts frequently collect this variable. Statistical institutes publish demographic data at this level. Commercial data platforms segment the market by postcode. This means that building an opportunity map with this granularity is technically feasible for most organisations with a minimum of analytical maturity.
What Variables should a Territorial Opportunity Map Include?
A territorial opportunity map is valuable when it brings together variables capable of explaining the potential and performance of each area. Its richness will depend on the quality and diversity of the variables that feed it.
A robust model integrates at least 5 dimensions.

1. Demand potential
This dimension estimates how much the business could sell in each territory if it captured its natural market share. To build it, variables such as disposable income per household, average family size, working-age population density, the expenditure index in the category and sector consumption data published by statistical sources or specialised providers are combined.
In retail, demand potential does not always coincide with current sales volume. There are territories with high purchasing capacity where the brand has not yet penetrated well, and others where demand is more mature but growth is already limited. Therefore, the map must allow for a distinction between market size and actual capture.
Demand potential answers the question: How much opportunity is there in this area? Without this estimation, any performance analysis lacks context.
2. Current performance
The second layer analyses the performance of the territory at the present moment. It includes indicators such as sales, average transaction value, purchase frequency, year-on-year evolution, margin or share per area. With these data, postcodes that are already offering good results and those that have not yet reached their potential are identified.
This block allows for putting actual performance into context against estimated potential. A territory may record a high volume of sales in absolute terms and yet be below what would be expected based on its size and profile. Similarly, there are areas with more modest figures that stand out for their high efficiency relative to their demand base.
By crossing both dimensions, the capture rate is obtained, i.e., the percentage of the available market that is already being captured. A low rate in high-potential territories points to growth opportunities, while a high rate in lower-potential areas usually indicates a scenario of maturity or saturation.
3. Coverage and distribution
Commercial opportunity does not depend solely on consumer interest, but also on effective access to the offer. This dimension evaluates the physical presence of the business: point-of-sale network, distance to the nearest establishment, travel times, overlaps between areas of influence and areas with insufficient coverage.
In many cases, low capture in high-potential territories is not due to a lack of demand, but to a limited or poorly distributed presence. Detecting this is key to not erroneously attributing the problem to factors such as competition or market interest.
Furthermore, it is advisable to analyse the quality of that coverage. Presence may exist in a postcode, but with poor execution: low visibility, limited assortment or irregular replenishment. In these cases, improvement does not necessarily involve expanding the network, but rather optimising how those areas are being operated.
4. Competition
Competition provides context and helps to understand if an area is underexploited or highly contested. It is worth analysing how many competitors operate in the territory, what type of format they have, what coverage they achieve and what share of presence they seem to have.
Competitive analysis allows for detecting areas where the brand can gain space with a differentiated proposal, but also territories where the pressure is so high that investment requires a more solid justification. In an opportunity map, competition does not only indicate risk; it also signals where active demand exists and, therefore, where it is worth fighting for share.
The underlying logic is similar to that proposed by Huff: the attraction of a commercial area depends on the relative attractiveness of the offer and the cost of accessing it. In modern retail, that attractiveness includes assortment, price, convenience, brand awareness and competitive pressure.
5. Assortment and price variables
Some organisations add a fifth layer to the map: the suitability of the assortment and price positioning to the socioeconomic profile of each territory. An assortment that is misaligned with local purchasing power, or prices perceived as inappropriate for the context, can limit capture even when potential and coverage are favourable.
Incorporating this variable requires crossing internal category and price data with the economic profile of each area. When done well, it allows for designing assortment localisation strategies with a direct impact on conversion.
This approach is highly relevant for Retail Intelligence platforms that work at the intersection of territory, pricing and assortment. The commercial opportunity of a postcode does not depend solely on opening more points or selling more units; offering the right mix for that competitive and socioeconomic environment also plays a part.
How to Interpret the Map to Make Commercial Decisions
The opportunity map is only useful if it is turned into action. The key lies in interpreting it as a prioritisation tool, not just as a pretty visualisation. To do this, territories should be organised based on a combination of opportunity, performance and ease of activation.
- High-priority growth territories: high potential, low capture, adequate coverage and moderate competition. These are the natural candidates to receive more commercial investment, acquisition campaigns and assortment reinforcement.
- Consolidation territories: high potential, medium or high capture, well-established presence. Here, the priority is to retain customers and extract more value from the transaction without cannibalising already achieved positions.
- Strategic review territories: low potential, high capture, oversized coverage. These may be candidates for resource reallocation or, in extreme cases, a review of physical presence.
- Territories with identified barriers: high potential, low capture, but with clear causes such as insufficient coverage or high competitive pressure. They require specific decisions before increasing commercial investment.
The value of the map appears when it helps answer the question “what do I do first and where”. This categorisation of territories turns the map into a prioritisation tool, not just a descriptive one. It allows the management team and the commercial area to speak the same language and make decisions based on shared objective criteria. At this point, territorial intelligence ceases to be an analytical exercise and becomes an operational guide.
Common Errors when Using Territorial Maps
The use of commercial maps provides a lot of value, although it also presents risks if the analysis is oversimplified. Here are some of the most frequent errors:
- Building the map and not updating it: The market changes: competitors open and close, neighbourhood demographics shift, buying behaviour changes. A static map loses relevance within a few months.
- Working only with internal data: If the analysis is built solely on own sales data, the map describes the business’s past, not the market’s potential. The external data layer is essential.
- Ignoring granularity: Aggregating data at a provincial or regional level eliminates the differences that the map should highlight. The value of the analysis lies precisely in the ability to distinguish between adjacent areas.
- Analysing only volume and forgetting context: A territory may seem attractive based on absolute sales, but hide high commercial costs, strong competitive pressure or low profitability. Prioritising without looking at margin, coverage and real potential can lead to inefficient decisions.
- Treating the map as an end in itself: The utility of the map is measured by the decisions it generates, not by its technical sophistication. Without a clear process to translate the analysis into concrete actions, the exercise loses value.
Avoiding these errors improves the quality of the diagnosis and increases the impact of commercial prioritisation.
How to Scale this Approach with Retail Intelligence
Building a territorial opportunity map manually, crossing diverse data sources and keeping it updated, involves a high cost in time and resources. In organisations with extensive networks or especially fragmented markets, this complexity grows exponentially.
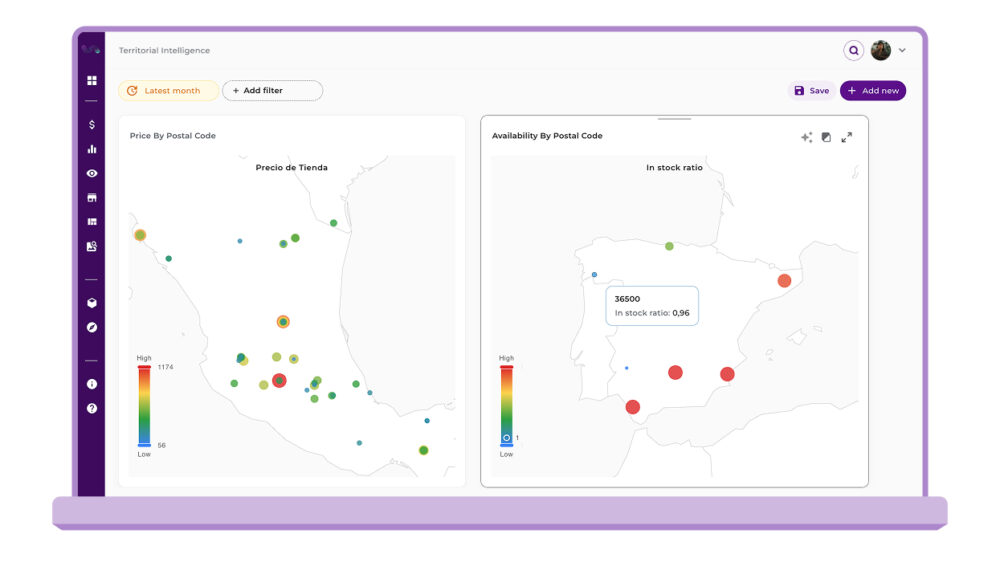
Scaling this approach requires a technological foundation capable of integrating several layers of information in a single environment:
- Internal sales and distribution data
- Assortment and pricing variables
- Geographical information
- Competitive signals
- Dynamic visualisation of the territory
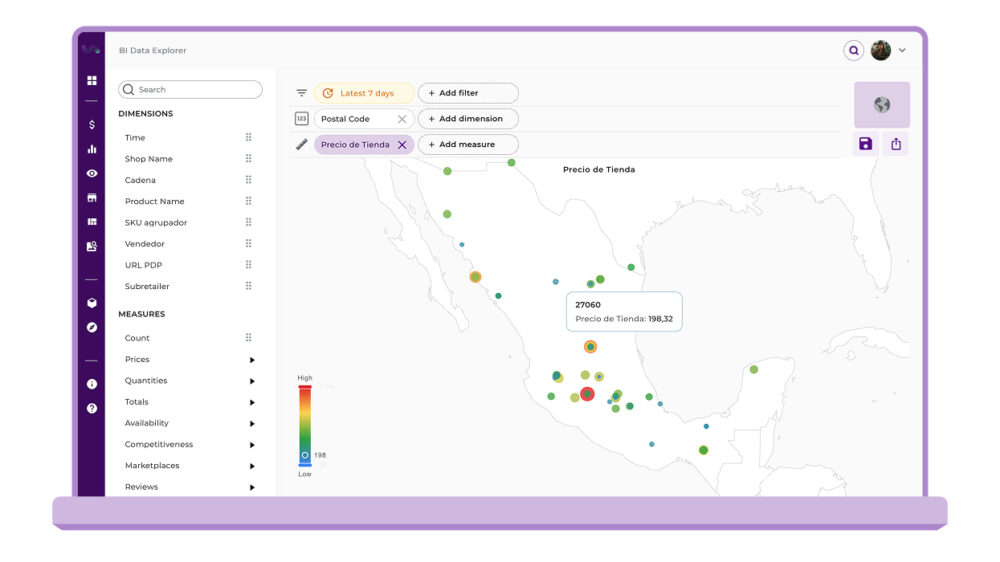
Retail Intelligence platforms solve this problem by automating the integration of internal and external data, normalising variables at the postcode level and generating territorial visualisations that are updated periodically. This allows the opportunity map to stop being a one-off analysis and become a recurring operational tool.
Solutions such as flipflow, focused on Assortment, Pricing and Territorial Intelligence, allow for this approach to be maintained over time. It is not just about visualising the map, but about identifying opportunities by postcode, understanding which levers generate the greatest impact in each area and prioritising actions with consistent criteria. The result is more coherent decision-making, better allocation of commercial effort and a greater concentration of resources where the potential return justifies it.

From Intuition to Territorial Precision
Territorial intelligence by postcode is not a tool reserved for large corporations with advanced data teams. With the right sources and a clear methodology, any retail organisation can build a model that transforms its way of prioritising markets and distributing resources.
The starting point is deciding to stop treating all territories in the same way. The next step is building the map. And the result, when done well, is a commercial team that stops operating by intuition and starts operating with data that reflects where the real opportunity lies.
In an environment where every point of sale, every SKU and every territory competes for resources, making better decisions on where to act makes the difference. The postcode offers a practical level of reading to do so with greater precision. And when that analysis is integrated into a Retail Intelligence strategy, territory takes its rightful place within commercial decision-making.