
Physical Store Checks and Geolocated Crawling: Two Sources, a Single Layer of Assortment Intelligence
TL;DR
Physical auditing and geolocated crawling stop competing to complement each other. The former provides the qualitative detail of the in-store visit, the latter provides the scale and daily frequency. When both sources share a standardised catalogue and the same territorial unit — the postcode — the result is a comparable and continuous layer of assortment intelligence, as demonstrated by the Grupo Lala case.
For decades, the physical store check has been the source of truth for assortment at the point of sale. A sales team visits the store, checks price, stock, and availability, and transfers that information into a report. The method works, but it has a structural limit: it costs money, has a weekly or monthly cadence, and never reaches all stores at the same time.
Large FMCG organisations allocate between €500,000 and €2 million annually to physical store audits, according to industry data. Even so, many still lack structural real-time visibility of their effective distribution. The problem does not lie in the effort, but in the data architecture: static audits with a lag of weeks, partial coverage, and subjective prioritisation.
Geolocated crawling, the automated and mass reading of availability and assortment by store or postcode, supported by digital sources and vision models, has appeared as a response to that limit. It does not replace the physical audit, but it covers the days and stores that the visit fails to reach. This article explains how both sources work, where each fails in isolation, and how they combine into a single layer of assortment intelligence: comparable, geolocalised, and continuous.
The Bottleneck of Traditional “Store Checks”
A store check is a structured in-store verification to measure how a brand, category, or promotion is being executed. It serves to answer specific operational questions: is there stock? is the price as agreed? is the planogram being respected? has the competition gained space?
The traditional model relies on face-to-face visits carried out by sales reps, merchandisers, promoters, or external agencies. Data capture is done via paper forms, photos without clear standards sent through instant messaging, and manual reports consolidated at the end of the week.
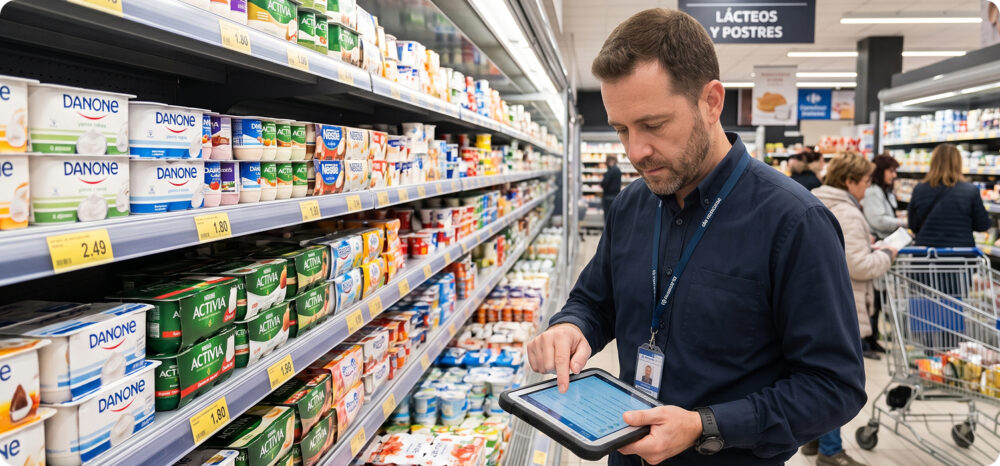
This approach presents structural limitations as the number of points of sale, references (SKUs), and the need to react quickly grow. The most common limitations include:
- Low effective frequency: not all stores are reached with the desired periodicity.
- Late data: “what has happened” is known only when “what to do” has already lost its impact.
- Difficulty validating data: photos without context, without confirmed location, or without the exact time.
- Inconsistencies in measurement: each person interprets “well executed” differently.
- Biases and manual errors: incomplete uploads, estimated values, duplicates.
- Poor traceability: it is difficult to reconstruct what was surveyed, where, when, and under what conditions.
According to a study by KX and the Centre for Economics and Business Research (CEBR), 80% of companies using real-time data report increases in revenue. Retailers that depend on delayed reports make decisions based on obsolete information and miss opportunities to capitalise on trends in the moment.
Geolocated Crawling: The Layer of Continuous Intelligence
Crawling, in its most technical definition, is the process by which automated software — a crawler — systematically traverses and analyses content, jumping from one source to another to extract structured information. This principle, well known in the SEO world as a mechanism for indexing web pages, is transferred to physical and digital retail with a different objective: instead of indexing pages, geolocated crawling recurrently reads availability, price, and assortment by store or postcode, combining digital sources with vision models applied to the shelf.
The difference compared to traditional store checks is not in what is measured, but in how many times and at what scale it can be measured. This continuous data layer allows for:
- Observation of the entire competitive ecosystem, not just the own brand.
- Early detection of changes in assortment and competitor movements.
- Permanent monitoring instead of periodic snapshots.
- Real-time alerts by postcode and retailer.
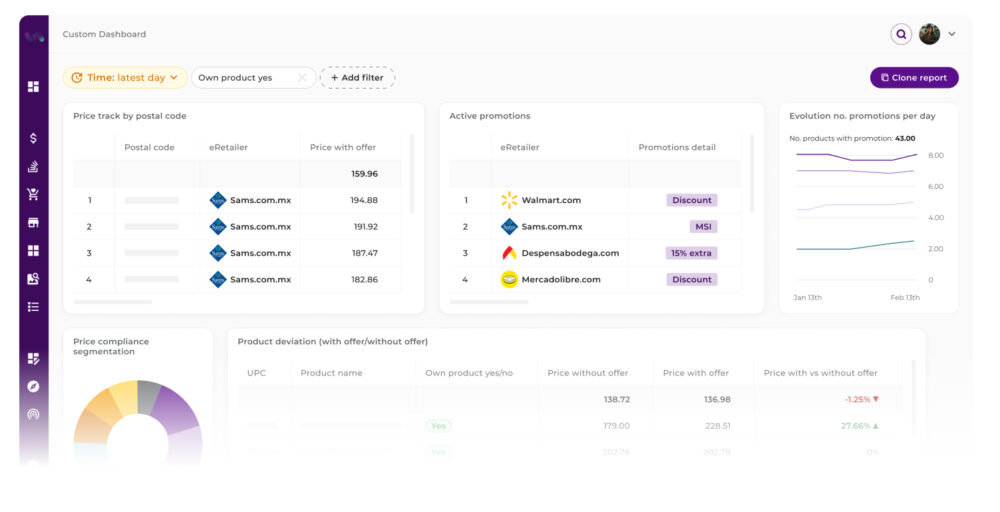
This does not mean that geolocated crawling solves everything a physical visit does. It still cannot verify nuances such as the exact quality of a promotional implementation. What it does provide is daily coverage between audits and a substantial reduction in the structural lag described earlier. In practice, territorial intelligence platforms like flipflow report precision levels exceeding 95% compared to traditional store checks in large chains, with real-time updates, allowing for permanent territorial surveillance.
The Architecture: How Both Sources Combine Without Duplicating or Contradicting Data
The underlying technical challenge is not choosing between physical auditing and geolocated crawling, but designing the structure that allows both sources to be used without contradicting each other. This requires solving three problems.
The first is cadence. Physical store checks occur with low frequency but with a level of human detail that crawling cannot always replicate. Crawling happens every day, with a more automated approach. Combining them requires treating the physical audit as a periodic reference verification and crawling as the continuous series that fills in the intermediate days.
The second problem is the catalogue. For a physical audit data point and a geolocated crawling data point to be compared, both must speak the same product language: same SKU, same attributes, same format. Without a catalogue standardisation layer, it is easy for the same reference to appear with different names or codes depending on the source, generating false gaps or false positives for availability. Advanced product normalisation is what turns two heterogeneous sources into a single comparable database by store and by postcode.
The third problem is geographic. As explained by the territorial intelligence by postcode approach, the postcode offers an intermediate level of detail: sufficient to locate opportunities without falling into unmanageable fragmentation. Anchoring physical auditing and geolocated crawling to this same territorial unit is what allows both sources to overlap on the same map, rather than generating two parallel readings of the same market.
Once these three problems are solved, the result is an architecture where each source covers what the other cannot: physical auditing provides qualitative detail; geolocated crawling provides frequency and scale.
5 Practical Steps to Structure Assortment Intelligence
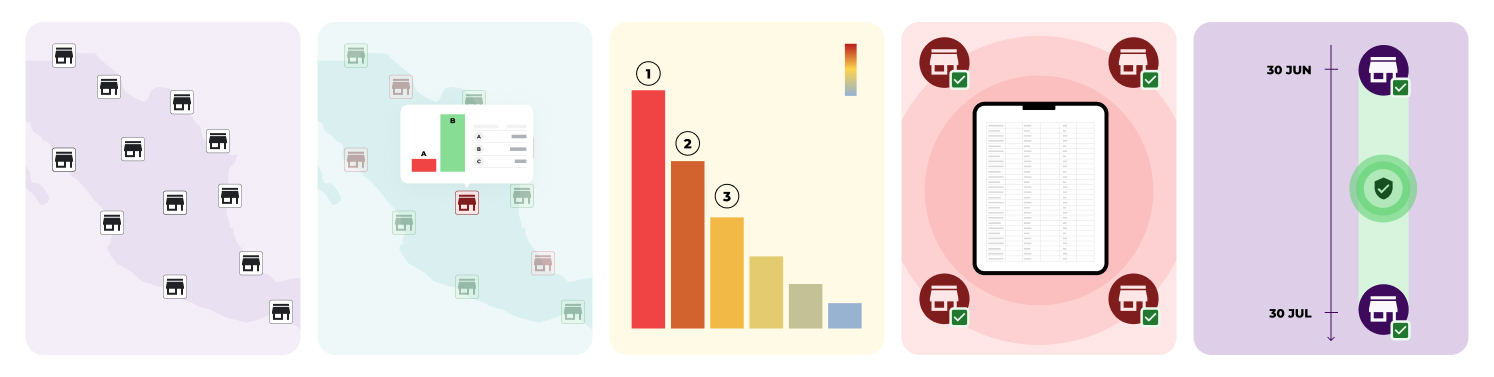
1. Complete assortment map by territory
The first step is to build an assortment map by territory that crosses category, retailer, and postcode, without yet distinguishing which source each data point comes from. This requires normalising the catalogue (attributes, formats, segments) so that each reference is identified in the same way in both sources, observing the entire competitive ecosystem, not just the own brand.
2. Automatic detection of gaps and delistings
On that map, the next step is to automate the detection of gaps and delistings: where the product should be and is not, when a delisting begins, and which competitor is occupying that space. Automation does not replace commercial judgement; it reduces the time between the problem occurring and the moment someone can solve it.
3. Territorial prioritisation by revenue impact
Not all territories have the same value. With the map and gaps identified, the third step consists of applying territorial prioritisation by revenue impact: rankings by potential revenue and risk models associated with each zone. This turns the list of problems into a list of priorities.
4. Structured and standardised physical store checks
Physical auditing does not disappear in this scheme; it is structured. Instead of an isolated expense producing loose spreadsheets, the store check becomes another entry for the same system, with the same standardised catalogue and the same territorial unit as the other sources. This allows for comparing, without contradiction, what the field team reports with what the crawling reports.
5. Continuous coverage beyond the audit
The final step is to incorporate geolocated crawling as a surveillance layer between physical visits. It is not about replacing the audit frequency, but about filling the temporal vacuum left by any model based on periodic visits, so that no gap has to wait weeks to be detected.
What Changes in Decision-Making When Data Is Continuous
The effect of moving from periodic snapshots to a time series of availability and assortment goes beyond the volume of data available: decisions stop being based on retrospective averages and start to rely on objective territorial evidence, updated and comparable across sources. This change the conversation with a retailer: instead of arguing over perceptions, each meeting starts from a homogeneous data structure on assortment, availability, and price.
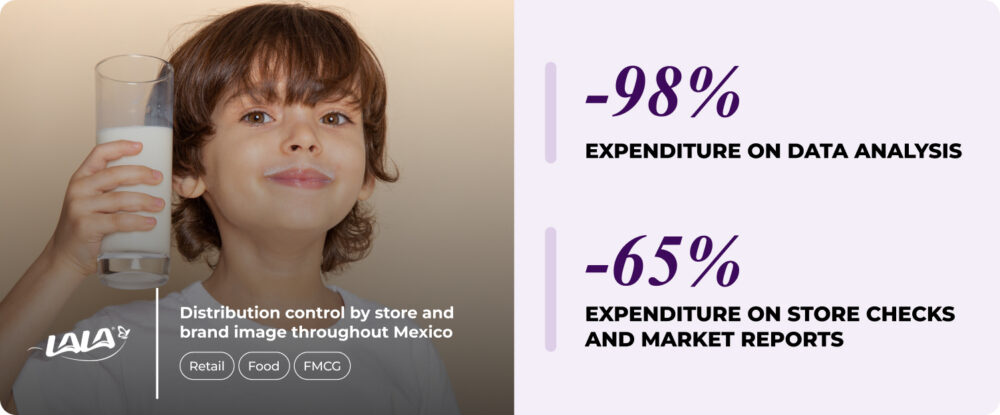
The case of Grupo Lala illustrates this change with concrete figures. The Mexican group, a world leader in the dairy industry, faced the challenge of controlling a territory as vast as Mexico, with a presence across multiple retailers and regions. A joint analysis with flipflow compared data collected in the field and online at the store level for ten products, contrasting them with reference sources like Nielsen’s Pricetrack: the data accuracy offered by the platform reached 98%. With that level of precision, Grupo Lala reduced the cost of performing store checks by 65%, and its Sales Department stopped depending on multiple manual sell-in and sell-out cross-references to generate a monthly report.
This result does not depend solely on crawling technology. It depends on the organisation having solved the underlying problem first. Having a standardised catalogue and a common territorial unit upon which both sources can coexist without generating contradictory readings. Without that foundation, more data does not produce better decisions; it only produces more noise to reconcile.
Conclusion: Two Sources, One Single Layer of Assortment Intelligence
The relevant question for any retail organisation is not whether to replace physical auditing with geolocated crawling, or vice versa. Both sources answer different needs: the qualitative detail of the in-store visit versus the scale and frequency of automated reading. What determines if that combination adds value is the data structure underneath: a standardised catalogue, a shared territorial unit, and a clear process to reconcile both sources on a single assortment map.
When that architecture is well resolved, the result is an assortment intelligence layer in which every territorial decision is supported by comparable, updated, and traceable data. Building that architecture from scratch, manually crossing field and digital sources, is precisely the work that consumes trade marketing and category management teams every quarter.
The Assortment & Pricing Territorial Intelligence module from flipflow solves that integration structurally: it normalises the catalogue, joins physical auditing and geolocated crawling under the same territorial unit, and turns both sources into a single actionable assortment map, like the one already used by groups such as Lala to prioritise where to act first. If you want to see how it would apply to your own store network, you can request a flipflow demo.