Black Friday 2025 Post-mortem: 10 Critical KPIs you Should Have Monitored in Real Time
Black Friday has become an event where every minute counts. During the days of maximum commercial intensity between Black Friday and Cyber Monday, brands face an unprecedented challenge: making strategic data-driven decisions while millions of consumers browse, compare and purchase simultaneously.
But when the party is over and it is time to take stock, the final question is always the same: What worked and what didn’t?
The difference between companies that triumph and those that simply survive Black Friday lies in their ability to monitor the right indicators at the precise moment. It is not enough to review the figures at the end of the day. The competition is fought minute by minute, and those with immediate visibility can react, adjust and optimise while the commercial battle unfolds.
This article analyses the 10 key indicators you should have watched during Black Friday 2025, explaining why they are vital and how to interpret them to turn data into concrete actions.
Why is “Real-Time” Non-Negotiable during Black Friday?
During Black Friday, the digital environment experiences extreme volatility. Prices fluctuate, inventories run out in minutes, competitors adjust their strategies and consumer behaviour changes depending on the time of day. Working with data that is even a few hours old equates to making decisions blindly.
Real-time monitoring allows critical problems to be detected before they turn into catastrophes. If your website starts loading slowly due to massive traffic, every additional second can translate into thousands of frustrated users abandoning your site. Detecting this problem six hours late involves losing a significant amount of sales. In real time, you can activate additional server resources or implement immediate technical solutions. The ability to react quickly also allows you to capitalise on unexpected opportunities. If one of your products performs exceptionally well due to a viral mention, you can increase advertising spend, secure additional stock or create complementary campaigns while interest is at its peak.
Furthermore, consumer behaviour in 2025 has been different from previous years. Nowadays, buyers visit multiple shops before deciding, compare prices online and offline simultaneously, and demand personalised experiences even during the shopping rush. An automated message arriving hours after they abandon the cart may be too late. A product recommendation that loads after the user’s attention span has lapsed will never be seen.
The retailers that have won Black Friday 2025 were not lucky. They had dashboards showing them exactly what was happening while it was happening, with alerts triggering immediate actions. While others analysed the data a day after Cyber Monday, they had already adjusted their strategies multiple times.
Critical Sales KPIs
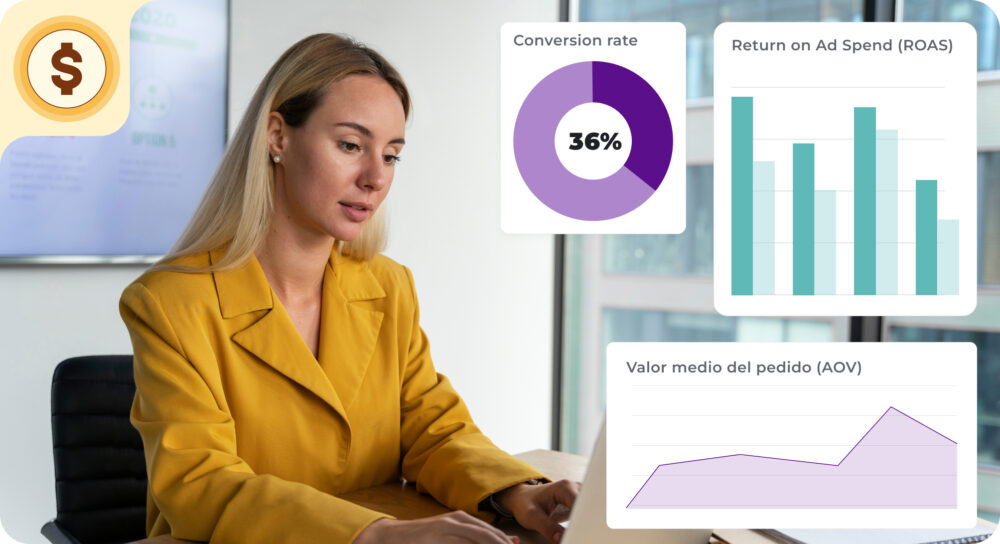
1. Conversion rate
The conversion rate measures the percentage of visitors who completed a purchase. During Black Friday, this indicator reveals if your attraction strategy is really working or if you are burning through budget bringing in traffic that does not convert.
The global average for e-commerce conversion is around 1.9%. For specific sectors such as beauty and wellness, rates of up to 6.8% can be reached. Brands in the top 20% of performance exceed 3.2%, and those truly optimised are around 4%.
The value of monitoring conversion in real time is being able to segment it by multiple dimensions simultaneously. Breaking it down by acquisition channel, product category, device or time slot reveals much more actionable information. You could discover that your conversion from mobiles is significantly lower than that from desktops. This real-time information allows you to immediately investigate if there is a technical problem, a confusing step in the purchase process on small screens or if your offers are not presented attractively on mobiles.
2. Return on Ad Spend (ROAS)
Return on Ad Spend (ROAS) measures how much revenue each euro invested in advertising generates. During Black Friday, where the cost of ads skyrockets, maintaining a healthy ROAS becomes a complex and vital balancing act.
If you invest one thousand euros in ads and generate five thousand euros in attributable sales, your ROAS is 5:1. During Black Friday, a ROAS of 3:1 or higher is usually considered successful, although it varies by sector and margins.
Real-time monitoring of ROAS allows you to redistribute budget dynamically. If one campaign obtains a ROAS of 7:1 while another barely reaches 2:1, it makes sense to move budget towards the first. This flexibility can significantly multiply the total effectiveness of your investment.
3. Average Order Value (AOV)
Average Order Value (or AOV) indicates how much an average customer spends on each transaction. This KPI is especially revealing during Black Friday because it reflects the effectiveness of your cross-promotion, product bundling and volume offer strategies.
Monitoring AOV in real time allows you to evaluate if your tactics to increase basket size are working. If you have implemented offers like “free shipping on orders over 50 euros”, the AOV will immediately show you if customers are responding to these incentives. The AOV also reveals if your discounts are attracting high-value customers or bargain hunters. A customer buying with an AOV of 150 euros deserves different treatment to one buying for 35 euros.
On the other hand, a sudden drop in average order value may indicate that your discounts are so aggressive that customers are only buying individual products without exploring the rest of your catalogue. Detecting this trend in real time allows you to adjust the presentation of complementary offers or modify the thresholds of your promotions.
User Behaviour KPIs
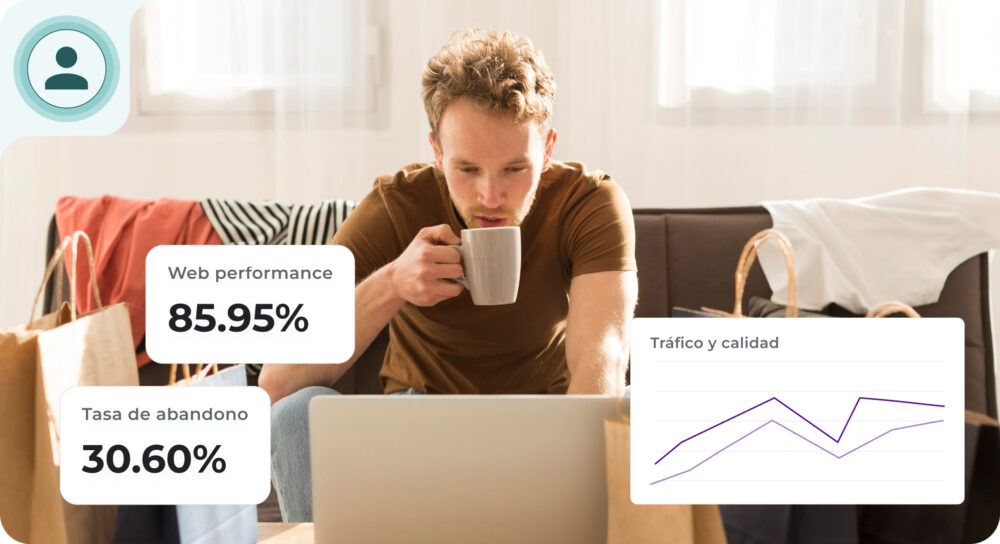
4. Traffic sessions and traffic quality
The volume of sessions reflects how many users visit your site, but during Black Friday you need to go beyond simple counting. Receiving 100,000 visits during Black Friday means nothing if 80,000 are bots or accidental clicks.
Traffic quality matters as much as or more than quantity. Thousands of visitors leaving your page immediately represent a cost with no return, especially if you paid to attract them.
Quality is evaluated via metrics such as bounce rate, average time on site and pages viewed per session. High-quality traffic shows low bounce rates, prolonged times and multiple pages visited.
During Black Friday it is fundamental to segment traffic by acquisition source. Organic traffic usually shows higher purchase intent than generic paid traffic. Understanding which channels bring you higher quality visitors allows you to optimise budget allocation.
5. Web performance
Loading speed directly influences conversions. Studies show that every additional second can reduce conversions by between 7% and 20%. During Black Friday, when users actively compare multiple shops, a slow site equates to lost sales.
Monitoring must include technical metrics such as time to first byte, full load time and time to interactive. During massive traffic events, it is common for performance to degrade progressively. Your site may start loading in two seconds but slow down to five or six as traffic increases.
In addition to general performance, you need to watch the highest value pages: best-selling products, cart and checkout. A performance problem at any of these critical points disproportionately affects your results.
6. Cart abandonment rate
Cart abandonment measures the percentage of users who add products to the cart but do not complete the purchase. This indicator reflects friction in the final stages of the conversion funnel, where the customer has already shown clear intent.
In e-commerce, 70.22% of carts are abandoned on average. On mobile, that rate rises to 75.5%. During Black Friday, these numbers can vary significantly, especially in fashion (84.4%) and luxury/jewellery (81.4%). The most frequent reasons include unexpected shipping costs, complex checkout processes, lack of preferred payment options or that the customer is comparing options.
During Black Friday, monitoring abandonment in real time allows you to implement immediate countermeasures: activate retargeting campaigns, send automated reminders or offer additional incentives specifically aimed at users with abandoned carts.
Competitive Monitoring KPIs
7. Competitor price tracking
During Black Friday, prices fluctuate constantly. A product costing €199 at 10:00 in the morning may cost €169 at 11:15 because a competitor dropped the price first. Monitoring competitor prices in real time allows you to maintain your strategic positioning.
Monitoring does not necessarily imply matching every offer. It requires understanding your positioning strategy and acting accordingly. If your differentiation is based on service or quality, you can afford not to be the cheapest, but you must know the price difference to ensure your value proposition justifies it.
8. Buy Box and visibility in marketplaces
If you sell on marketplaces like Amazon, getting the Buy Box drastically determines your sales volume. Most buyers complete the purchase from the Buy Box without exploring alternative offers. Losing the Buy Box equates to losing visibility and sales.
Algorithms consider multiple factors: price, stock, shipping speed, seller rating and fulfilment history. During Black Friday, these factors fluctuate constantly.
Monitoring your position minute by minute allows you to react before losing too many sales. If you lose it, you can analyse which factor displaced you and decide if adjusting your offer makes strategic sense.
9. Stock and availability
Inventory is the most common bottleneck on Black Friday. Correctly predicting how much stock you need is almost impossible. Monitoring availability in real time prevents two disasters: running out of stock when there is still demand, or having excess stock that you do not sell later.
Having automated alerts when stock drops to 20% of what was planned, by category and by SKU, allows you to make decisions in real time. You can increase the discount to accelerate sales before a stockout, switch your ads to products with better availability, or simply order express restocking if there is still time.
It is equally important to monitor your competitors’ stock. If a rival runs out of stock of a popular product that you still have available, you can temporarily increase your advertising spend to capture the unsatisfied demand.
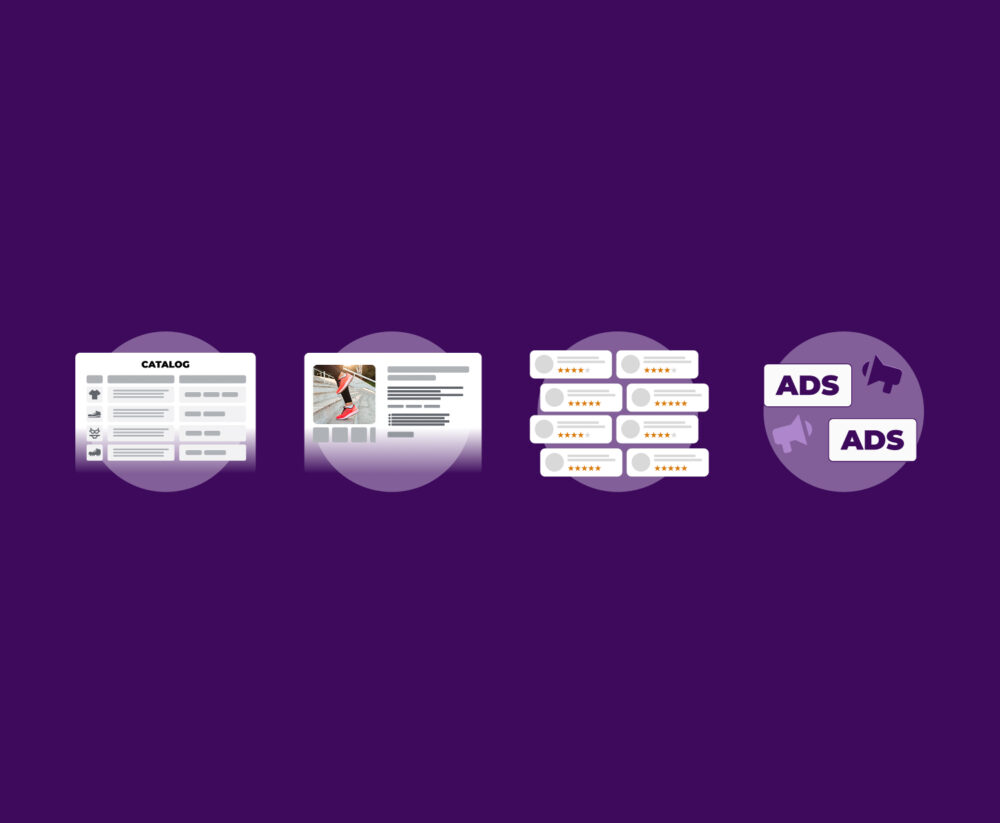
Digital Shelf Analytics
Digital Shelf analytics goes beyond sales: it measures your visibility, which predicts future sales.
10. Share of Voice and visibility
Share of Voice measures what percentage of the digital conversation in your category belongs to you. This indicator combines search engine positioning, presence in marketplaces, social media mentions and volume of advertising impressions compared to the competition.
During Black Friday, your visibility in search results, marketplaces and digital media determines what portion of the total demand you can capture.
Real-time monitoring of Share of Voice allows you to identify specific opportunities. If your presence in searches for a category is low compared to your general positioning, you can adjust your content strategy or increase the bid on those keywords.
Architecture of a Real-Time Dashboard
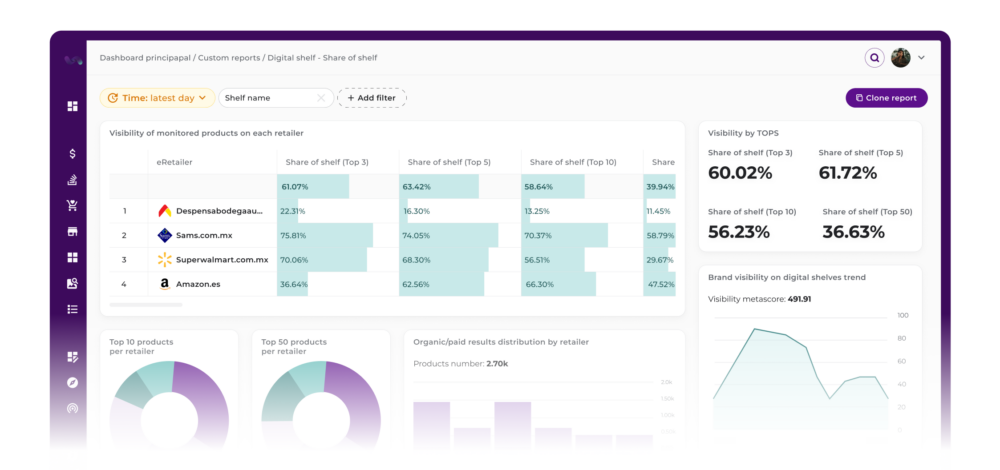
Building an effective monitoring system requires careful technical planning. All the real-time monitoring demanded by an event like Black Friday can now be centralised in a single platform: flipflow. Instead of building complex integrations between multiple tools, flipflow unifies data from e-commerce, Retail Media, marketplaces, stock and competition in a single environment, allowing for an instant reading of the business.
In flipflow you can create the dashboards you want and organise the information your way, by priority levels. Thanks to its integration capacity, flipflow connects in real time with your proprietary data sources. This eliminates delays, information silos and technical dependencies, ensuring that all decisions are always based on updated data.
Furthermore, flipflow’s automated smart alerts turn the dashboard into an active surveillance system. You can define thresholds to detect stockouts, loss of Buy Box or aggressive price movements by the competition. Instead of constantly checking the panel, the system notifies you when something requires immediate action. Thus, the team moves from analysing data to acting at the exact moment when sales can still be saved.
Conclusion: See First, React Faster, Win Later
Black Friday has transformed into an event where analytical capacity and reaction speed determine who leads the biggest consumption event of the year. The ten KPIs analysed represent the indispensable minimum to compete effectively.
The fundamental difference between companies that fully take advantage of Black Friday and those that let opportunities slip away lies not in the size of their budget or the aggressiveness of their discounts, but in their ability to see what is happening while it is happening and act accordingly.
Preparing adequately for future commercial events requires investing in the technical infrastructure that makes this real-time visibility possible. Integrated dashboards , automated alerts and trained teams represent competitive advantages as important as the product you sell itself.
Because the next Black Friday will not start at the beginning of November 2026. It starts today, in how you build your monitoring system, how you define your critical indicators and how you train your team to interpret data when every minute counts. And when the next Black Friday of 2026 arrives, you won’t improvise: you will act with full knowledge of the facts.