
Practical Guide to Creating an Opportunity Map by Postcode in Retail
TL;DR
An opportunity map by postcode allows for identifying where untapped commercial potential exists. It is used to prioritise territories, adjust assortments, guide sales visits, and distribute budgets using objective criteria. The result is more precise decision-making and a better return on commercial effort.
In modern retail, making commercial decisions based on national averages is a path to inefficiency. Two postcodes can share similar demographics on paper and behave radically differently in terms of sales, brand penetration, or response to promotions. The relevant question for any sales manager, trade marketing, or category manager is not what is happening at a national level, but exactly where it is happening and why.
Territorial intelligence answers that question. And its central tool is the opportunity map by postcode: an analytical visualisation that represents the commercial potential of each area and allows it to be compared with current business performance. The utility of this type of analysis lies in answering very specific questions: Where is there the most potential demand for my category? In which areas am I below what I could be selling? Which territories have room for improvement in distribution, assortment, or price?
Geomarketing has been answering these types of questions for decades. Thanks to advances in geocoding, most large organisations in the sector have begun combining location data with demographic and behavioural analysis to create more precise and profitable strategies. What has changed in recent years is the accessibility of these tools and the ability to keep the analysis continuously updated, not as a snapshot, but as an always-on system.
This guide describes the complete process for building an opportunity map by postcode, with each step detailed and action-oriented, followed by the most relevant use cases in the retail environment.
How to Build an Opportunity Map by Postcode Step by Step
Step 1. Define the business objective
Before touching any data, you must clearly establish which decision the map is intended to support. An opportunity map can have many uses, but its design changes according to the objective.

Some common objectives are:
- Increase sales in territories with low penetration.
- Detect postcodes with potential for opening new points of sale.
- Prioritise sales team visits.
- Adapt the assortment by area.
- Improve the efficiency of local campaigns.
- Identify areas where the competition has a greater presence.
- Reduce risks of delisting in certain territories.
- Adjust prices according to local market conditions.
Defining the objective from the start determines which data is essential, which variables enter the opportunity score, and how the results are interpreted.
If the objective is not clear, the map ends up being just a pretty visualisation. Conversely, when the goal is well-defined, every piece of data you add to the map will have a specific function and the analysis will be much more actionable.
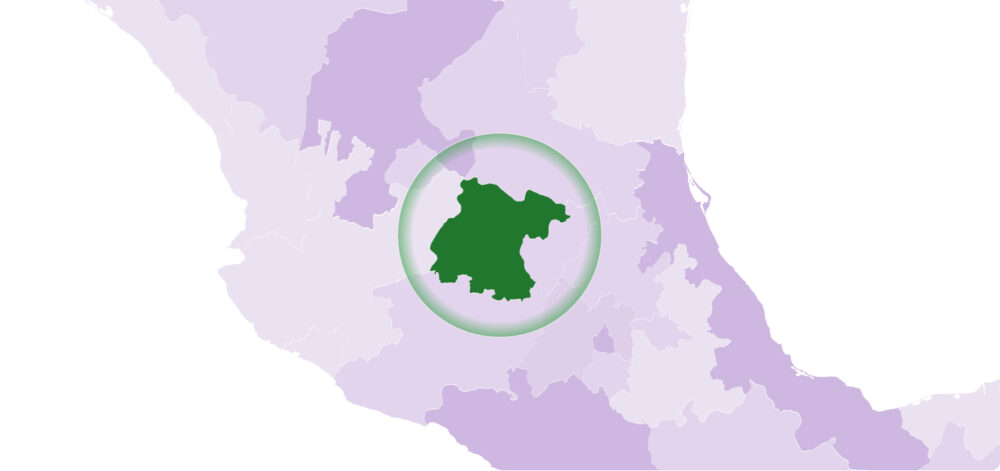
Step 2. Choose the appropriate territorial unit
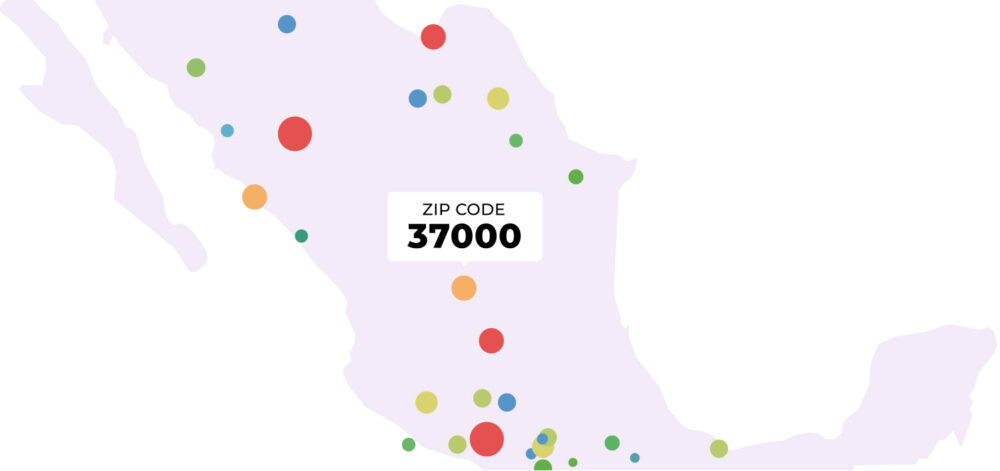
The postcode is the most common unit because it combines sufficient granularity with data availability. However, depending on the type of business and the specific objective, it may be more useful to work with municipalities, census tracts, provinces, or even catchment areas defined by travel time.
For FMCG retail and physical store distribution analysis, the postcode offers the right balance: it is small enough to detect relevant differences between urban areas or between neighbourhoods in the same city, and large enough for external statistical data (income, demographics, population density) to be reliable and comparable.
The choice of territorial unit also affects the scale of the analysis. A postcode-level map in a large city may have hundreds of units; a provincial-level one may have fifty. The territorial unit should help you make an actionable decision. The key is to use a unit that is stable, comparable, and easy for teams to activate.
Step 3. Cross-reference internal and external data
This is the step where the map acquires real analytical depth. In this step, you must cross-reference your own sales data with external information that contextualises current performance.
Common internal data:
- Sales by point of sale or territory, normalised by postcode.
- Numeric distribution (number of active points over the total available).
- Assortment by store and by area.
- History of sales visits and results.
Relevant external data:
- Socio-demographic data by postcode: average income, household size, age pyramid, education level.
- Density and typology of points of sale in the area.
- Presence and assortment of competitors by territory.
- Category consumption data or panel data aggregated by region.

You can also incorporate assortment and pricing intelligence data. This allows you to analyse whether the available assortment in an area matches local demand, whether prices are aligned with the competitive environment, or if there are relevant differences between territories.
Retailers that collect the postcode at the point of purchase or through loyalty programmes have a significant advantage: they can directly map the geographic concentration of their clientele and cross-reference it with census demographic data to understand what type of consumer buys from them, where they live, and where the brand is not reaching.
Territorial intelligence platforms automate this cross-referencing, normalising variables to the postcode level and generating visualisations that are updated periodically. This allows the opportunity map to stop being a one-off analysis and become a recurring operational tool.
Step 4. Create an opportunity score
With the data cross-referenced, the next step is to build a composite metric that summarises the potential of each territory into a single comparable value: the opportunity score.
This score usually combines several dimensions with different weights according to the objective:
- Market potential: estimated category size in that area, based on consumption data, demographics, and density of points of sale.
- Current performance: own sales, active distribution, or estimated share relative to potential.
- Gap: difference between estimated potential and current performance. The larger the gap, the greater the theoretical opportunity.
- Competitor presence: level of competitor saturation in the area, which modulates the ease of capturing the opportunity.
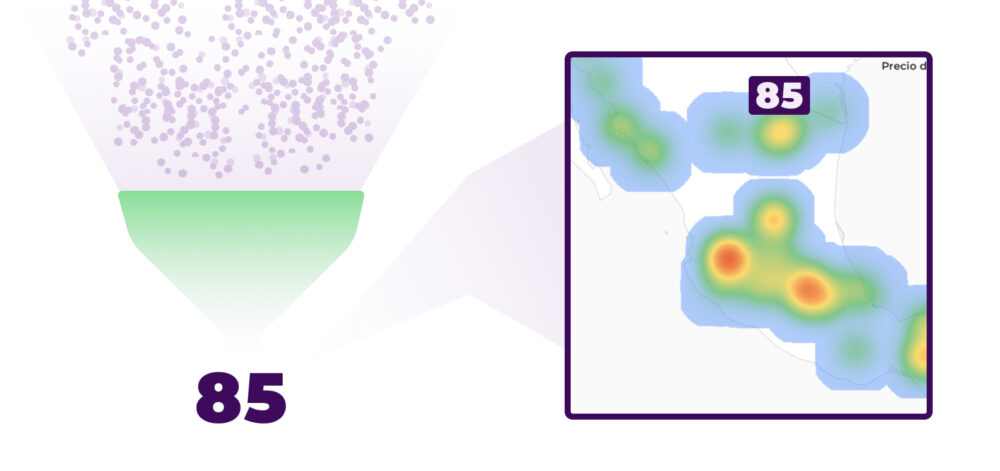
The essential part is to normalise the variables to be able to compare them. If one variable is in pounds, another in percentage, and another in number of inhabitants, it is advisable to transform them to a common scale, for example from 0 to 100. The resulting score converts multi-variable complexity into a simple number that allows territories to be ranked from highest to lowest opportunity.
Heat maps by postcode are the most intuitive visual representation of this score: more intense colours indicate the areas where attention should be concentrated.
Step 5. Segment the territories
A continuous opportunity score is useful for ranking, but segmenting territories into groups facilitates rapid, consistent operational decision-making. Common segments combine two axes: opportunity level (high/medium/low) and current performance (high/medium/low).
A typical segmentation can generate four action groups:
- Priority growth territories: high opportunity, low current performance. These are the ones that justify a greater investment of commercial resources.
- Consolidation territories: high opportunity, performance already good. The goal is to maintain and defend the position.
- Monitoring territories: moderate opportunity with a tendency to improve or worsen. They require tracking but no immediate action.
- Low priority territories: little opportunity and low performance. They only deserve attention if there are changes in the competitive or demographic context.
This segmentation should be reviewed periodically, as territories can migrate from one group to another due to changes in distribution, competitive activity, or the demographic composition of the area.
This approach avoids applying a uniform strategy to all territories. In retail, local differences influence demand, competition, and profitability. Segmenting allows actions to be adapted according to the real behavior of each zone.
Step 6. Prioritise by impact and feasibility
The final layer of the map must answer a very practical question: which areas deserve to be acted upon first. This turns the map into an action plan. Not all high-opportunity territories are equally feasible to activate with available resources. Final prioritisation combines the opportunity score with operational criteria:
- Estimated impact: how much incremental volume or margin the activation of that territory can generate.
- Feasibility of activation: geographic distance from sales teams, available logistical coverage, existing relationships with key operators in that area.
- Cost of activation: necessary investment in visits, trade actions, point-of-sale materials, or assortment adjustments.
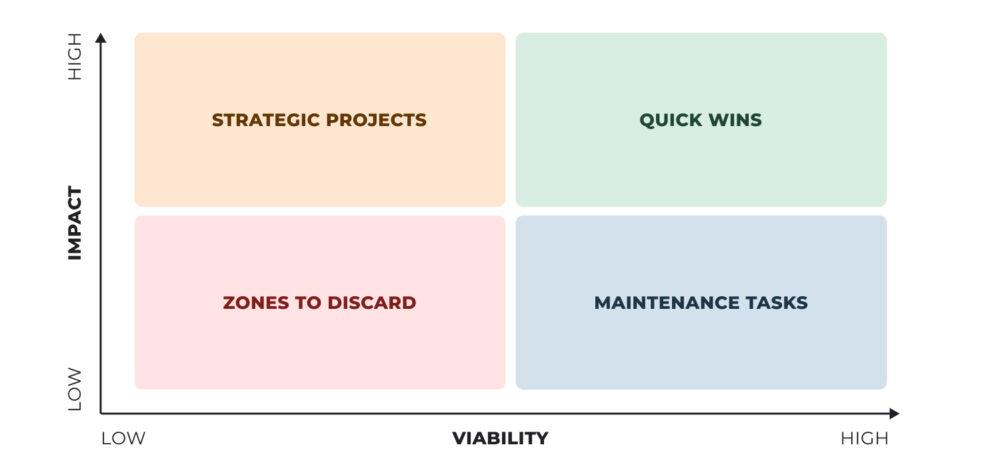
The combination of impact and feasibility allows for the construction of a prioritisation matrix that guides the team toward territories where the return on effort is highest. High-impact, high-feasibility territories are the first on the agenda; high-impact but low-feasibility ones move to a medium-term plan.
The map must be updated periodically. Opportunities change due to new openings, price variations, competitor actions, population changes, seasonality, campaigns, and evolving shopping habits. A monthly or quarterly review is usually useful for retail teams with high commercial activity.
Use Cases in Retail
The utility of an opportunity map is measured by the decisions it allows you to make, not by the sophistication of the analysis. Below are the five most common use cases in retail and FMCG organisations. Each one starts from the same principle: converting territorial data into concrete actions with a measurable impact on the business.
Detecting zones with assortment gaps
One of the most direct uses of the territorial opportunity map is the identification of areas where the active assortment in store does not reflect the category’s sales potential. A brand may have 27 references available at points of sale in one postcode and only 15 in another with a similar socio-demographic profile. That difference has a measurable cost in lost sales.
Territorial intelligence allows you to visualise the real assortment by store and by postcode, detect inconsistencies relative to the area average or to what is distributed in comparable territories, and build a structured argument to negotiate with operators for assortment expansion where demand is backed by data. Instead of arriving at the shelf with perceptions, the sales team arrives with geolocated evidence.
Organising sales visits by impact
Sales teams always have more territories to cover than resources allow. Without data-based prioritisation criteria, route planning and visits tend to replicate previous habits or respond to specific emergencies, rather than maximising business impact.
The opportunity map allows for assigning each territory, and by extension each point of sale, a priority value based on the gap between potential and actual performance. Sales teams stop acting by inertia and start concentrating time where the return is highest. This improves commercial productivity and also helps justify route decisions with objective data.
Prioritising local campaigns
Local activation campaigns have a higher return when designed for territories where untapped demand exists. The opportunity map allows you to identify those postcodes and inform decisions on where to concentrate investment in local advertising, point-of-sale promotions, events, or sampling actions. It also allows for detecting areas similar to those already performing well. This “territorial lookalike” logic helps expand campaigns with less risk and better budget use.
By cross-referencing the opportunity score with income and demographic profile data by postcode, it is also possible to adapt the message and offer to the characteristics of each area, increasing the relevance of the action and improving conversion. Many marketing apps and platforms already allow for showing differentiated content based on user location, making territorial segmentation directly impactful on digital channels as well.
Reallocating trade marketing resources
Trade marketing budgets are rarely distributed optimally from a territorial point of view. They are often assigned following historical sales volume (reinforcing where sales are already good) instead of being oriented toward where the greatest potential for incremental growth exists.
The opportunity map reverses that logic. High-potential, low-performance territories are, by definition, those with the greatest capacity to respond to a trade investment. Reallocating resources such as point-of-sale materials, promoter staff, or activation budgets toward those territories improves the overall trade marketing ROI and accelerates share capture in under-penetrated zones.
Identifying territories with risk of delisting or cannibalisation
The opportunity map is not only for finding where to grow: it also helps detect where there is a risk of losing position. A territory where sales drop below estimated potential in a sustained manner may be a signal that a competitor is gaining shelf space, that a silent delisting is occurring, or that there is an availability problem that aggregate reports are not capturing.
By monitoring the real assortment by postcode and cross-referencing it with sales signals, it is possible to detect delistings the moment they happen and act before they become permanent. Similarly, it allows for identifying cannibalisation situations between own references in the same territory, where the introduction of a new SKU is reducing sales of another without generating net incremental volume. Cannibalisation can also occur between physical and online channels. If certain postcodes show strong digital growth and a store decline, territorial analysis can help understand if it’s replacement, complementarity, or a change in customer behavior.

From Postcode to Commercial Action
A well-constructed opportunity map by postcode transforms the way commercial and trade marketing teams make decisions about the territory. It stops being an isolated analytical exercise and becomes the starting point for data-driven planning: which areas to activate first, where to adjust assortment, how to distribute trade budget, or when to anticipate a distribution problem before it affects results.
Building the map requires combining internal data with external information, normalised at the postcode level, and translating it into an actionable opportunity score. Territorial intelligence tools like flipflow automate much of that process, making map maintenance continuous rather than dependent on one-off analytical projects.
The remaining question for any retail organisation is not whether territorial analysis is relevant—it is—but whether the level of granularity and updating used today is sufficient for precise decision-making. In markets where competition operates at the postcode level and consumers expect an offer adapted to their environment, working with national or regional data no longer provides the same advantage as working with data from each territory.