Digital Shelf + Internal Data: Get the Full Picture of Your E-commerce Performance
Imagine you have two mirrors. One shows you how others see you. The other reflects how you feel on the inside. Separately, each mirror gives you valuable information. But when you put them together, you get a complete picture of reality.
The same thing happens with data in e-commerce. Internal performance data shows you the numbers you already know: sales, margins and conversions. Digital Shelf data reveals what’s happening in the market: how customers find you, what they see of your competition, and why they choose or dismiss your product.

Most companies work with just one mirror. They make decisions with incomplete information. They miss out on growth opportunities and make avoidable mistakes.
In this article, we’ll explain how to combine both types of data so you can learn to create a comprehensive view of your digital business. This is the only way to see the full picture of your e-commerce performance and discover what you’ve been missing until now.
The 2 Sides of the Same Coin: Defining and Combining the Data
What is internal performance data? (The “WHAT”)
Internal performance data is the numbers your own business generates. It originates within your company and reflects your business activity. It’s the data you already know and handle every day.
This data includes sales by product, channel and period. It also covers customer acquisition costs and profit margins. Conversion rates, average order value and purchase frequency are all part of this group.
Internal systems like your CRM, ERP or e-commerce platform generate this information. Google Analytics, Facebook Ads Manager and email marketing tools also contribute valuable data.
The strength of this data lies in its precision. It is accurate because it comes directly from your transactions. It allows you to measure the real performance of your marketing and sales actions. It’s ideal for calculating return on investment and planning budgets.
However, it has a significant limitation. It tells you what happened, but not why it happened. It shows you that sales have dropped, but it doesn’t reveal whether it was due to a visibility, price or competition issue.
What is Digital Shelf data? (The “WHY”)
The Digital Shelf represents everything that happens at the digital point of sale. It is the virtual space where consumers go to browse, discover or buy a product; it’s an analogy for the shelves you would find in any physical shop, brought into the digital world.
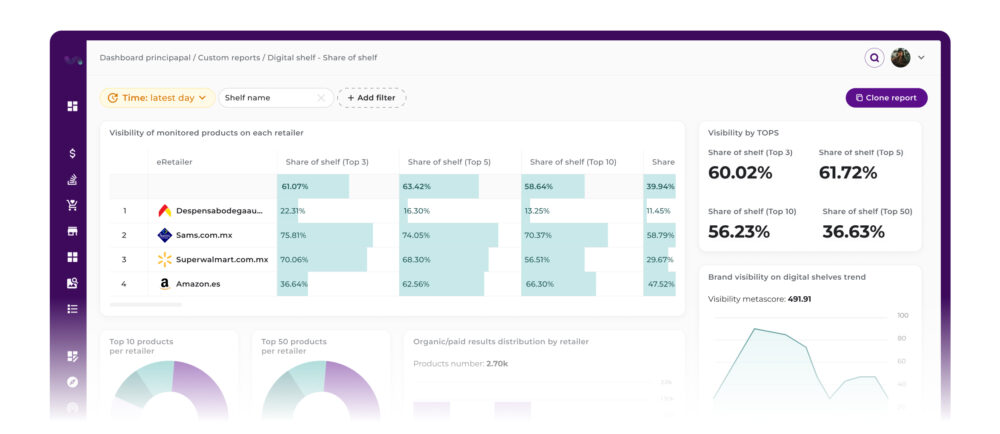
Digital Shelf data captures this activity. It includes your visibility in searches, the position of your products in the results, and your Share of Shelf against competitors. It also measures stock availability, relative prices and the quality of your content.
According to the Market Guide for Digital Shelf Analytics report by Gartner, companies that replace manual external monitoring processes with automated Digital Shelf Analytics solutions can reduce their operating costs by up to 30% annually by 2026.
The Digital Shelf data comes from specialised tools that monitor marketplaces and search engines, like flipflow. They analyse Amazon, Google Shopping, vertical markets and online shops. They gather information on reviews, ratings, product images and descriptions. Its main value lies in revealing the context. It explains why a product sells well or poorly. It identifies opportunities for improvement in positioning and content. And it also detects competitive threats before they impact your sales.
The weakness of this data is that it doesn’t connect directly to your financial results. You can have excellent visibility but few conversions. Or a good Share of Shelf but insufficient margins.
The Power of Combining the Two Sides
The magic happens when you combine both types of data. This combination generates insights that neither set of data can offer alone.
Consider this scenario. Your internal data shows a 20% drop in sales for a star product. Your Digital Shelf data reveals that a competitor has launched an aggressive pricing campaign. Now you can see the full picture: you know what happened and why it happened.
Other common issues that can be solved by combining Digital Shelf data with internal performance data include problems due to seasonality, identifying pricing and promotion opportunities, or content and compliance errors.
Internal data provides the precise view of what is happening inside your business, while Digital Shelf data reveals the external context that explains these performance variations. Integrating both allows you to see the complete picture from both mirrors, where figures stop being isolated numbers and become actionable insights. With flipflow, this exercise is no longer complex: our platform integrates your internal performance data with Digital Shelf analytics in a single environment, offering you the ability to connect the “what” with the “why” and move towards more informed decisions.
4 Tangible Benefits of This Synergy
1. Complete Visibility
The first benefit is gaining a comprehensive view of the customer journey. This view allows you to understand each stage, from discovery to purchase.
Digital Shelf data shows you how the customer finds you. It reveals the searches they perform, the products they compare and the factors that influence their decision. Internal data tells you what happens next: if they buy, how much, and how often.
This complete visibility eliminates blind spots in your strategy. You no longer work with assumptions about customer behaviour. You have concrete evidence of their preferences and purchasing patterns.
2. Agile, Data-Driven Decision-Making
Combining data speeds up decision-making. You reduce the time between identifying a problem and implementing a solution. When you detect a drop in sales, you can immediately check if it’s a problem with visibility, price, stock or competition. This speed allows you to react before the impact worsens.
Decisions also become more precise. You have the full context to evaluate all options. You can better predict the impact each action will have on your final results.
3. ROI Optimisation
This synergy significantly improves the return on your digital marketing investments. You can identify exactly where to invest to get the greatest impact.
Digital Shelf data shows you products with high visibility but low conversion. Internal data reveals which ones have the best margins. This information guides you to invest in optimising the conversion of profitable and visible products.
You can also spot products with good conversion but low visibility. Investing in increasing their digital presence generates fast, measurable results.
4. Competitive Advantage
The combination of data gives you a significant advantage over competitors who work with fragmented information. You can anticipate competitor moves and prepare proactive responses. You can identify market niches that others don’t see, and can also optimise your product mix based on real market data.
This advantage is especially valuable in dynamic markets where changes happen quickly. Complete information allows you to adapt better and faster than the competition.
From Data to Decisions: How Integration Drives Brand Strategy
Integrating internal performance data with Digital Shelf data isn’t about enriching dashboards; it’s a strategic lever that transforms how brands make decisions. The first major impact is on investment optimisation. When a drop in internal sales can be explained by a decrease in share of shelf or a lack of availability at retailers, the brand can redirect resources to where they truly generate a return. What was once intuition now becomes data-backed evidence.
A second key impact is the defence and growth of market share. By connecting margin and conversion information with the evolution of prices and promotions on the Digital Shelf, the brand understands not only what is happening but also how its competitors are acting. This allows it to anticipate moves and design more agile responses.
Furthermore, integrating sources facilitates a common language between internal teams. Marketing, trade and sales teams often work with different metrics, but when everyone analyses cross-referenced data between their own performance and the competitive environment, a shared vision emerges that speeds up decisions and avoids silos.
Finally, this union opens the door to predictive analytics. If a pattern of decline in negative reviews predicts a drop in internal conversion, the brand can act before the impact becomes significant. Ultimately, it’s not just about explaining the past, but about anticipating the future and acting with a competitive advantage.
The Real Magic: From Fragments to the Full Picture Through Data Integration
Working with internal data or Digital Shelf data in isolation can provide partial answers, but it also creates uncertainty and leads to decisions based on assumptions. The real leap forward happens when brands manage to unite these two perspectives and have them interact within the same environment.
The value isn’t in accumulating more metrics, but in connecting the ones that truly matter, so that every figure has context and every insight is turned into action. This integration clarifies the present and creates a compass for the future, helping to anticipate opportunities and safeguard the strategy against an increasingly dynamic market.
The challenge now is not whether you should do it, but how to do it in the simplest, most scalable way possible. Tools like flipflow make this process less of a technical puzzle and more of a natural practice within e-commerce management.
Ultimately, combining your internal data with Digital Shelf data is the difference between looking at fragments and seeing the full picture of your digital business. A story that will not only explain what happened, but will also guide you on what’s to come.