Retail Media in European Cosmetics: Paid vs. Organic and the Efficiency Paradox
Retail media has become one of the most powerful growth levers in European beauty e-commerce. As shoppers move their skincare routines online and search for solutions across Amazon, specialist pharmacies and beauty retailers, cosmetics brands are locked in an increasingly competitive battle for digital visibility. Sponsored Products, Sponsored Brands and display formats now shape what consumers see, what they click and ultimately what they buy. In a sector worth close to €120 billion, how brands appear on these digital shelves is no longer a tactical concern. It is a core driver of growth, profitability and market share.
Against this backdrop, a fundamental strategic question has emerged for marketing and e-commerce teams: how much should be invested in paid media to sustain visibility, and at what point does that investment become inefficient.
Analysts expect retail media to account for just over one‑fifth of global digital ad spend in 2025, while many CPG brands already allocate around a quarter to a third of their digital budgets to retail media channels—health and beauty brands often sit at the upper end of that range, reflecting the category’s performance focus and intense competition. As retail media networks scale on the back of retailers’ first-party data and brands’ demand for measurable, conversion-focused performance, the line between necessary investment and diminishing returns is becoming harder to define. In cosmetics, where competition for physical shelf space has fully translated into competition for digital placement, the tension between paid and organic visibility is especially pronounced.
How the Benchmark Looks at Retail Media in Beauty
The Retail Media section of the benchmark analyses the paid advertising activity that brands deploy within retailer sites and marketplaces. It considers both how often a brand appears thanks to paid placements (Paid Share) and how often it appears organically (Organic Share).
The Paid Dependency Ratio, compares the level of paid investment with total visibility. A high ratio highlights brands that must spend heavily to secure modest presence. A low ratio indicates that organic equity and content are doing much of the work, with paid media acting as an accelerator rather than the main engine.
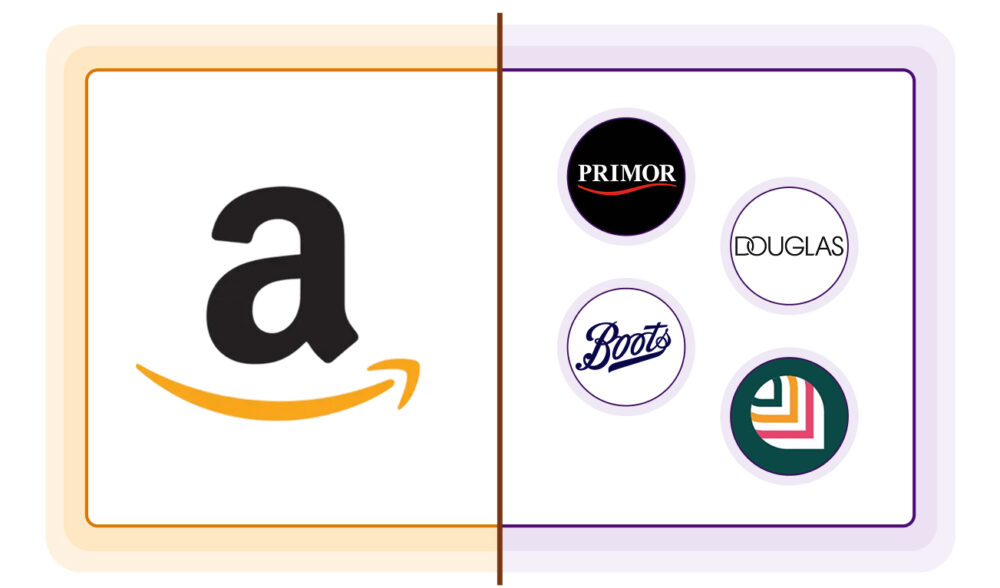
Data comes from Q3 2025, covers 12 leading beauty brands and the results are broken down by country and by retailer, with a particular focus on Amazon and selected specialists: Primor (Spain), Douglas (Italy), Boots (UK) and Easypara (France).
While the first post of this series focused on organic Digital Shelf visibility, this second instalment dives into paid versus organic share, investment strategies, efficiency dynamics and the strategic gaps that are shaping the next phase of competition in European beauty retail media.
National Investment Patterns: From UK “Pay‑to‑Compete” to France’s Organic Bias
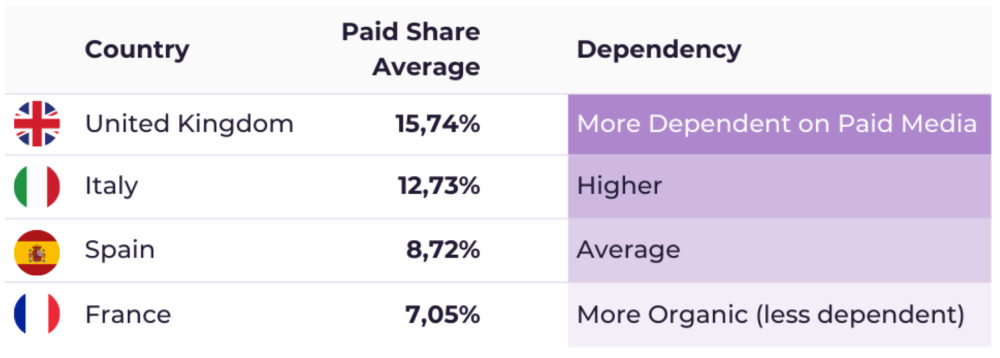
One of the most striking findings from the report is the dramatic variation in how brands allocate resources between paid media and organic visibility across the four European markets studied. The data reveals a clear gradient of paid-media intensity, where the United Kingdom stands out as the most paid‑dependent country, with an average Paid Share of 15.74% across brands. Italy follows with 12.73%, then Spain with 8.72%, while France remains the most organic‑driven market at 7.05%.
This gradient mirrors the competitive dynamics observed on the Digital Shelf. In the UK, high levels of paid activity create a “pay‑to‑compete” environment where sponsored placements act as an entry ticket rather than a differentiator. Even brands that are usually organic‑leaning, such as Vichy or Nivea, increase their paid mix sharply when operating in British retail media.
Italy shows similar but slightly lower dependency, with many brands using paid media to secure visibility within a fragmented retailer ecosystem. Spain, by contrast, demonstrates a more balanced approach. Some brands, such as Olay and Nivea, invest aggressively, whereas others maintain almost entirely organic presence. France goes further in that direction; limited retail media expenditure aligns with the dominance of long‑established pharmacy brands and a strong organic base built over decades of offline credibility.
For international beauty teams, these differences mean the same paid strategy cannot be rolled out uniformly. Budget allocations and expectations of return must be calibrated per country.
Brand Archetypes: Distinct Paid vs. Organic Strategies
The benchmark reveals a clear segmentation of brand strategy aligned with product positioning and category characteristics. Understanding these archetypes provides actionable intelligence for brands contemplating their paid media investment levels.
Dermocosmetic and Pharmacy Brands: Paid-Media Dependent
Brands positioned in the dermocosmetic and pharmacy segment—including Neutrogena (14.72% global average paid share), Olay (14.02%), and Vichy (13.89%)—show consistently higher reliance on paid media across markets. This pattern reflects category dynamics where paid visibility often functions as a table-stakes requirement: consumers accustomed to searching for functional, efficacy-driven skincare products in competitive retail environments expect sponsored results to occupy prominent positions.
Additionally, these brands often compete against a deep bench of dermocosmetic options, necessitating paid investment to defend and expand shelf presence. The investment profile suggests that in the dermocosmetic category, organic presence alone—no matter how well-optimised—carries insufficient weight to compete effectively against brands willing to bid aggressively for high-intent keywords.
Mass-Market and Equity-Led Brands: Organic Foundations
In contrast, globally recognised brands with established equity and heritage demonstrate lower paid dependencies. L’Oréal Paris records a global average paid share of just 5.31%, and Garnier reaches 8.46%. These lower ratios reflect the outsized weight of organic factors for mass-market brands: content depth, review velocity, social proof, and consumer awareness drive discoverability independent of paid support.
Niche and Regional Brands: Highly Polarized Profiles
Smaller or more regionally focused brands exhibit the widest range of paid strategies. Cantabria Labs invests minimal paid resources globally (1.30% average) yet achieves 11.80% visibility in its home market of Spain through organic strength, demonstrating the power of local equity. Sesderma records virtually zero paid investment (0.09% average) and shows weak performance across all markets, reflecting either a strategic choice to compete exclusively on organic factors or, more likely, insufficient resources for paid media investment in highly competitive environments.
Where Beauty Brands Spend: Amazon, Specialists and Ad Formats
Across the four markets, Amazon is the central engine of retail media in beauty. Around half of all spend flows to Amazon placements, underlining its importance for both scale and conversion. Primor in Spain, Douglas in Italy and Boots in the UK form a second tier of investment, capturing meaningful but much smaller portions of spend. Easypara in France receives minimal budget, which is consistent with that country’s broader organic tendency.
This distribution reveals a dual reality. Amazon concentrates performance media, where brands chase lower‑funnel conversions at scale. Specialist retailers, on the other hand, play a crucial role in shaping brand and category perception within their home markets, even if paid spend there is lower. For example, Primor remains fundamental for beauty in Spain, Douglas for Italian prestige and Boots for skincare credibility in the UK.
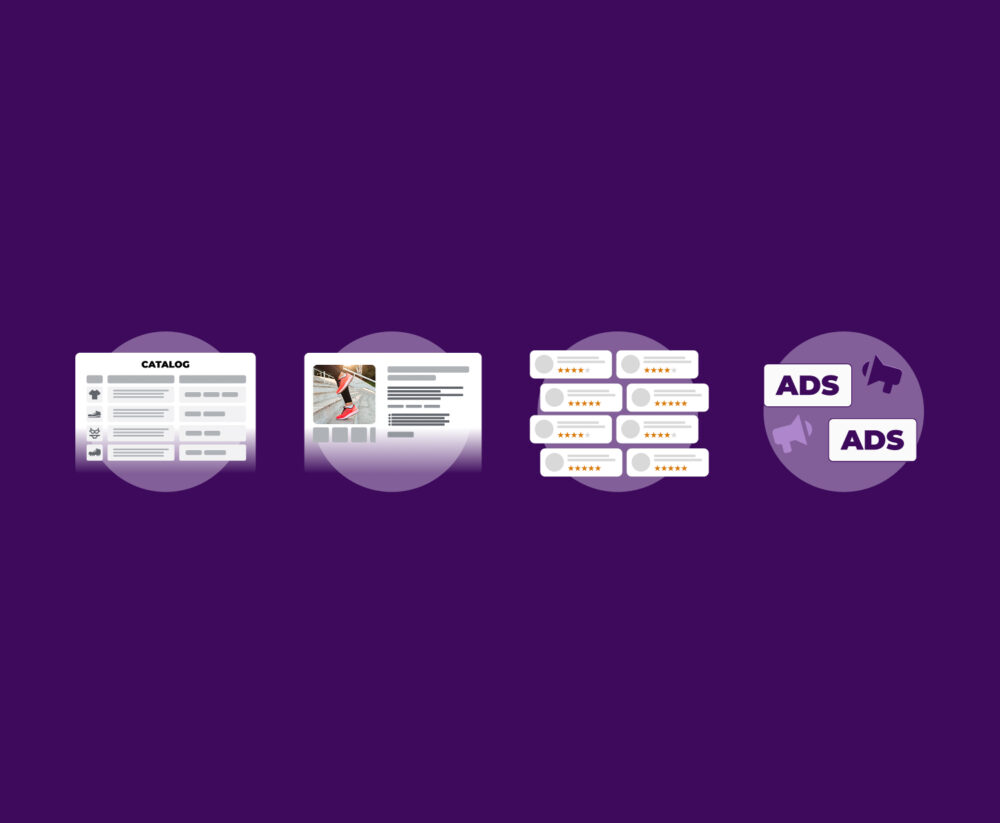
A similar skew appears in ad formats. Sponsored Products account for roughly 59% of investment, far outweighing Sponsored Brands (around 18%), Sponsored Display (about 14%) and Sponsored Video (just over 8%). Beauty advertisers favour placements that have direct impact on ranking and conversion, often on product listing pages where shoppers are making final choices.
The downside of this configuration is an underinvestment in upper‑funnel and mid‑funnel tactics—especially video—that could drive awareness, education and long‑term preference for more complex or premium lines. Many brands are concentrating their budget on immediate performance at the expense of building future demand.
Efficiency Analysis: The Paid Dependency Ratio
One of the most illuminating insights from the benchmark is the Paid Dependency Ratio—a metric that compares the share of visibility paid through advertising against the total visibility achieved. When this ratio is high, brands are paying disproportionately for visibility; when it is low, organic fundamentals are doing the heavy lifting and paid media acts as an accelerator.
High Dependency: The Efficiency Warning Signal
Certain brand-market combinations show alarming inefficiency. Vichy in the UK stands out as the most glaring example: investing 33.33% of budget into retail media yet achieving only 5.52% total visibility creates a 6.04x dependency ratio, indicating severe misalignment between spend and results.
Common drivers of high dependency ratios include:
- Weak product detail pages: Insufficient content, missing attributes, or poor images that fail to convert paid traffic into sustained visibility
- Thin reviews and ratings: Limited or recent review velocity that reduces algorithmic weight and shopper confidence
- Misaligned targeting: Broad keywords or placements that generate impressions but not conversions, inflating spend while diluting efficiency
- Competitive overbidding: Excessive competition for branded or category keywords that drives CPCs beyond rational ROI thresholds
High Efficiency: Organic Leverage
In contrast, several brand-market combinations demonstrate exceptional efficiency. Cantabria Labs achieves 11.80% visibility in Spain with only 0.45% paid investment (0.03x ratio), indicating that organic equity is driving the vast majority of visibility. Garnier in Spain shows similar efficiency: 18.54% total visibility with just 3.88% paid share (0.21x ratio). Weleda in the UK, despite a substantial 20.59% paid share, converts this into remarkable 27.71% total visibility (0.74x ratio) due to strong organic fundamentals that amplify paid investment.
These efficiency leaders share common characteristics:
- Rich product content: Detailed descriptions, multiple attributes, and comprehensive information aligned to retailer taxonomies
- Strong review profiles: Abundant, recent, and authentic reviews that generate algorithmic weight and consumer confidence
- Precise keyword coverage: Targeting of high-intent, lower-competition terms where paid investment delivers outsized impact
- Solid baseline equity: Established brand recognition and consumer familiarity that reduce the burden on paid media to drive discovery
The Blind Spot Problem: Zero Paid, Zero Visibility
A critical finding from the analysis concerns brands with zero paid investment in specific markets. Sesderma, Cantabria Labs, and Bella Aurora record 0% paid share in several countries (notably France and the UK for all three brands), resulting in 0% total visibility in those markets.
This pattern reveals a fundamental market dynamic: in high-friction, competitive environments, organic visibility alone cannot lift a brand from a standing start. Without initial paid investment to generate impressions and traffic, even high-quality organic fundamentals remain invisible. The remedy requires a staged approach: minimal initial investment focused on hero SKUs and localised high-intent keywords with manageable competition, paired with immediate investment in organic strengthening—content enrichment, reviews and ratings seeding, and structured data optimisation—so that early paid investment converts into sustainable organic visibility.
Key Conclusions and Strategic Takeaways for Beauty Brands
Flipflow’s benchmark points to several structural truths shaping competition for beauty brands in Europe. Market leadership, first of all, is neither uniform nor purely budget-driven. The brands that dominate Digital Shelf visibility in a given country are not always the biggest investors in paid media. Some outperform through strong organic equity and content execution; others rely heavily on tactical spend. Defining the right balance between these levers at both brand and market level is now a prerequisite for setting realistic objectives and budgets.
Efficiency, meanwhile, varies sharply by geography. The UK stands out for its high Paid Share combined with some of the weakest Paid Dependency Ratios, signalling intense competition and a growing risk of overpaying for marginal visibility gains. Spain shows the opposite dynamic. In a more organic-driven environment, brands such as Garnier and Cantabria Labs convert limited paid pressure into strong and resilient presence.
Investment patterns remain heavily biased towards Amazon and lower-funnel formats. While this approach delivers conversion at scale, it often leaves strategic gaps in awareness, education and premium brand storytelling, all critical in higher-value skincare. Specialist retailers continue to shape brand perception in their core markets and deserve a more central role in retail media strategies aimed at authority building, not just short-term sales.
The key takeaway is clear. Sustainable Digital Shelf performance is built on the synergy between organic strength and targeted paid amplification. Buying visibility alone leads to rising costs and fragile rankings. Relying solely on organic equity risks disappearing in markets where competitors invest aggressively. For category managers and e-commerce leaders, Flipflow’s “Digital Shelf & Retail Media Performance in European Beauty – Q3 2025 Cross-Market Benchmark” provides the empirical foundation to design this balanced model with confidence. Download it to access brand-level visibility scores, paid versus organic splits and retailer-specific efficiency diagnostics.