
Availability, Price, and Consumer Insights: The Three Data Points that Reveal Actual Demand in Digital Retail
TL;DR
The combination of stock, price, and consumer opinion offers a much more accurate view of demand than any isolated data point. Correlating these signals helps uncover lost sales, detect growth opportunities, and turn Digital Shelf data into actionable decisions for every team.
The Most Common Mistake in Demand Analysis
For decades, retail and FMCG (Fast-Moving Consumer Goods) companies have calculated their sales forecasting by looking exclusively in the rear-view mirror. The traditional method for planning inventory, setting prices, and estimating the success of a campaign has been based on internal historical transaction data, invoicing, and purchase orders sent from warehouses. However, this approach suffers from a fundamental problem: it only analyses what was actually sold, not what the market truly wanted to buy.

The most common error when analysing demand is confusing sales history with actual demand. Spreadsheets reflect absolute numbers of past transactions, but they do not record opportunities lost due to out-of-stock issues, sudden changes in user preferences, or the effects of dissatisfaction that hinder conversion at the point of sale. When planning models ignore variables occurring outside the internal management system, companies are left exposed to significant information gaps.
In the digital environment, where touchpoints multiply and the buyer’s journey is constantly fragmented, relying solely on historical shipping or sales metrics causes critical distortions. A product may show a downward sales trend not because it has lost public interest, but because it suffers from chronic visibility or stock issues across distribution channels. Similarly, an increase in turnover can mask a reputational problem that will destroy sales in the next quarter. To understand market demand in real-time, it is essential to simultaneously observe what is available, at what value it is offered, and what the buyer thinks about the experience.
The Three Dimensions Defining Actual Demand
To capture current buying signals, retail analysis must be structured around three interconnected pillars that determine performance in the digital environment.

Availability (Stock)
The physical or digital presence of an item is the starting point for any transaction. According to a NielsenIQ analysis on availability monitoring on the digital shelf, stock issues are not limited to immediate loss of revenue: they erode the product’s organic ranking, reduce its future visibility, and, in many cases, generate negative reviews that persist long after the problem has been resolved. Consumers who find a product out of stock do not wait: they migrate to the available alternative, and that migration can become a lasting change in habit.
When e-commerce presence decreases, the share of visibility within the distributor’s catalogue (share of assortment) falls in parallel, relegating the product to secondary positions in internal search engines. Strict control of out-of-stock (OOS) situations through automatic alerts at store and warehouse levels is vital to avoid losing recurring buyers.
Price (Elasticity)
Price is the variable that retail teams tend to monitor most rigorously because its impact on conversion seems direct and measurable. However, the relationship between price and demand has nuances that classic elasticity models do not always capture.
Price elasticity of demand measures how the volume sold varies in response to a price change. While it is a useful tool, it is based on aggregated historical data and does not distinguish between two very different situations: whether a price is objectively high compared to the competition or whether the consumer perceives it as unjustified relative to the value received.
This difference between actual price and perceived value is only apparent when incorporating sentiment analysis. A highly-rated product can sustain a premium price because consumers support it in their reviews. In contrast, a product with an average rating may generate friction even with a competitive price, as it fails to offer sufficient justification for the purchase. Therefore, price elasticity in the digital environment must consider qualitative factors such as value perception, comparison with competitors, or attributes highlighted by users.
Furthermore, competitor pricing acts as a constant signal. If a competitor increases prices on a high-demand product with limited stock, an opportunity may open up to capture additional sales. Detecting this requires simultaneous monitoring of price, availability, and consumer perception.
Sentiment (The human variable)
Sentiment is the dimension most difficult to structure and, therefore, the one most frequently left out of operational analysis. Consumer reviews and ratings contain information of a density that no other commercial data can replicate. They reveal why the product satisfies or disappoints, which attributes generate loyalty and which cause abandonment, how perception evolves over time, and how the experience compares with equivalent products from the competition.
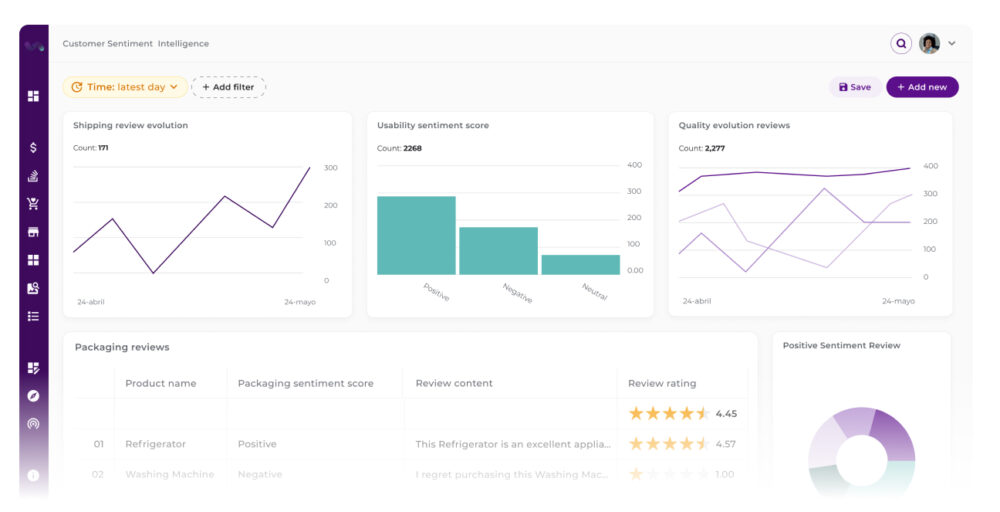
The common mistake is reducing it to a star rating average. That number averages out contradictory signals, hides trends by attribute, and does not allow for a distinction of what caused a drop in rating. As we explain with our Customer Sentiment Intelligence solution, the real value of sentiment analysis lies in breaking down the consumer experience by business dimensions (quality, packaging, durability, logistics, value for money) and connecting that information with actual commercial performance: ranking, share of search, and availability.
Research by Retail Systems Research (RSR) on the use of sentiment in demand forecasting documents that retailers operating in categories with high seasonality and trend items are those who extract the most value from incorporating sentiment data into their forecasting models, precisely because they act as leading signals for changes in demand: perception changes before sales reflect that change.
The Correlation of the Three Variables: When 1+1+1 > 3
Each of these three variables, taken independently, offers a partial reading. Their intersection produces something qualitatively different: the ability to diagnose situations that none of them can reveal separately.
Consider these four scenarios:
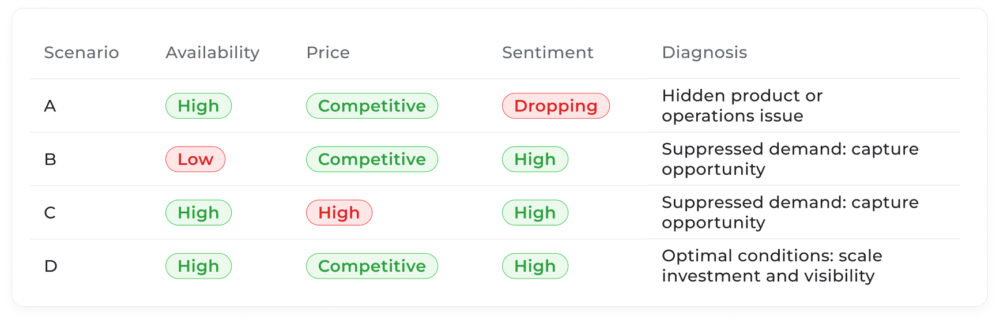
In scenario A, if only the stock and price dashboard is looked at, everything seems correct. But the progressive decline in sentiment anticipates a future fall in sales that has not yet occurred. In scenario B, low availability masks an actual demand much higher than what sales data reflects. Without the cross-reference with sentiment, that potential remains invisible. In scenario C, price acts as a barrier to entry even though product perception is positive: adjusting the price in that context can produce a disproportionate increase in conversion relative to the margin movement.
This correlation logic is at the core of modern demand sensing. Kinaxis defines it as a short-term forecasting method that integrates high-frequency signals (POS data, search trends, social sentiment) to improve forecast accuracy down to the SKU and region level. The key is that these signals are not analysed separately: they are cross-referenced to detect anomalies and patterns that models based solely on history cannot see.
Methodology for Correlating Them
Correlating availability, price, and sentiment operationally requires a structured process. It is not enough to have the three data points: they must be comparable, aligned in time, and allow for pattern detection at scale.
Step 1. Gather stock, price, and review data by SKU, channel, and period
The starting point is granularity. The initial phase consists of the automated and continuous extraction of information from the Digital Shelf. It is necessary to capture daily availability levels (whether the item is in stock or not, error codes on the page), final retail prices (including promotions, flash deals, or basket discounts), and user-generated content flow (new written reviews, variations in star ratings, and questions in the technical specs). This data must be strictly classified according to the product code (SKU), the specific sales channel (Amazon, Walmart, own store), and the exact date of record.
Step 2. Normalise metrics to make them comparable
Availability, price, and sentiment provide complementary information, but each variable is measured on different scales and follows different behavioural patterns. To analyse them together, it is necessary to normalise them and bring them into a common comparison framework.
This involves transforming stock into metrics such as availability percentage or out-of-stock rate, expressing price as an index relative to the competition, and converting sentiment into an aggregated score or a net evolution per SKU. Once normalised, the three variables can be compared directly, and it becomes easier to identify if they are evolving in alignment or beginning to diverge.
An especially useful approach is to express each metric as an index or percentile within its historical range for that SKU. In this way, variations acquire a comparable relative meaning: a 15% drop in sentiment has the same analytical weight as an equivalent reduction in availability, regardless of their absolute values. Furthermore, this approach facilitates comparison between products and categories, which is essential when managing broad and complex portfolios.
Step 3. Cross-reference temporal variations and points of sale
Correlation has greater analytical value when studied in terms of change, not level. What is relevant is not whether sentiment is high or low at a given moment, but whether it is rising or falling, in which channel, for which SKU, and whether that movement coincides with or precedes variations in availability or price.
With unified and clean data, algorithms align time series by geographical zones and commercial channels. This involves comparing price changes occurred in a specific week with fluctuations in review volume during that same interval and out-of-stock alerts associated with distribution centres in that region. Spatial and temporal cross-referencing ensures that observed effects correspond to well-identified local causes and not to global macroeconomic trends.
Step 4. Detect patterns and anomalies
Once normalised and temporally aligned, the data allows for the identification of two types of findings: patterns and anomalies. Patterns are recurring relationships, such as out-of-stock issues in a channel systematically generating an increase in negative logistics reviews weeks later. Anomalies, on the other hand, are deviations from these expected behaviours and require immediate investigation.
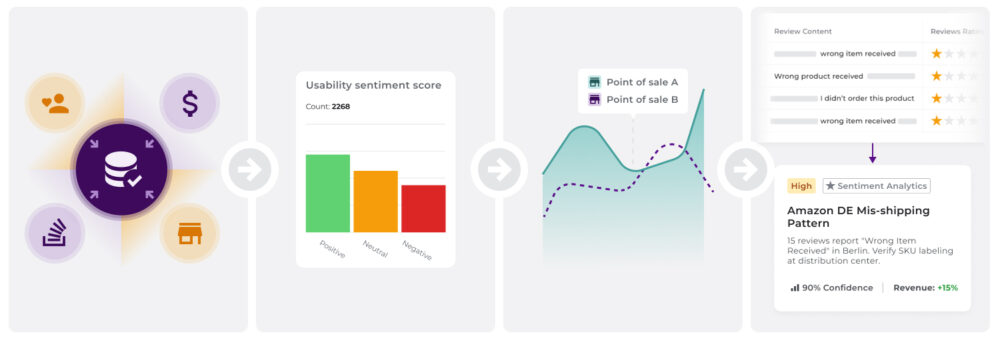
These anomalies can become operational alerts for decision-making teams. Flipflow facilitates this process by structuring reviews by attributes, connecting them with the product’s commercial context, and generating automatic alerts that allow for rapid action.
From Correlation to Decision: Who Acts on this Information
One of the most frequent obstacles in implementing this type of analysis is that data ends up concentrated in the analytics team without being translated into operational decisions for the teams that have the capacity to act. For data intelligence to provide real benefits to the organisation, analytical information must be distributed across different strategic departments of the company, driving specific actions in each area.
| Department | Signal Received | Strategic Action |
| Logistics and Supply Chain | OOS alerts in high-rating and unsatisfied demand channels. | Urgent replenishment of peripheral warehouses and safety stock adjustment. |
| Pricing and Commercial Management | Positive qualitative elasticity (excellent reviews validating price). | Withdrawal of unnecessary discounts and protection of profit margins. |
| Marketing and Retail Media | Drop in ratings or inventory issues in promoted SKUs. | Immediate pause of active advertising campaigns to avoid inefficient spending. |
| Product Development | Spikes in negative reviews concentrated on specific physical SKU attributes. | Modification of technical specifications with suppliers and quality control. |
This distribution of action requires that the analysis platform not only produces data but connects it with the workflows of each team. Flipflow structures this connection by integrating its Customer Sentiment Intelligence module with the Pricing & Seller Control, Digital Shelf Intelligence and Assortment & Territorial Intelligence modules, so that the sentiment signal is always interpreted in the context of full commercial performance and generates specific alerts for each team capable of intervening. By sharing a single source of truth about the market situation, decisions are made based on clear and objective empirical evidence.
Real Demand is a Composite Signal
Recorded sales measure demand that has materialised. The combination of availability, price, and sentiment measures the demand that could materialise, the demand that is being lost, and the reason why it is being lost.
This distinction has immediate practical consequences. It allows for the identification of where to invest (in stock replenishment, price adjustment, or product improvement) instead of applying generic solutions to problems that have different causes. It allows for the anticipation of sales drops before they occur, because sentiment evolves before conversion metrics. And it allows for the discovery of growth opportunities that historical sales data would never reveal, because suppressed demand, by definition, does not appear in the history.
The consumer is already constantly expressing their evaluation of every product: in the rating left after purchase, in the question that does not lead to conversion, in the review describing exactly what was expected and what was found. Structuring that signal, cross-referencing it with operational data on availability and price, and turning it into actionable decisions for the right teams is what differentiates a reactive digital retail strategy from one operating on real intelligence.
Want to explore how Flipflow connects sentiment analysis with your brand’s commercial performance across digital channels? Discover the Customer Sentiment Intelligence module.