
Maximise your visibility, revenue and margins, and detect unauthorised sales
From optimised digital shelves to high-impact retail media campaigns: maximise sales, stand out from competitors, boost marketplaces and dominate your presence on the digital shelf with real-time data.
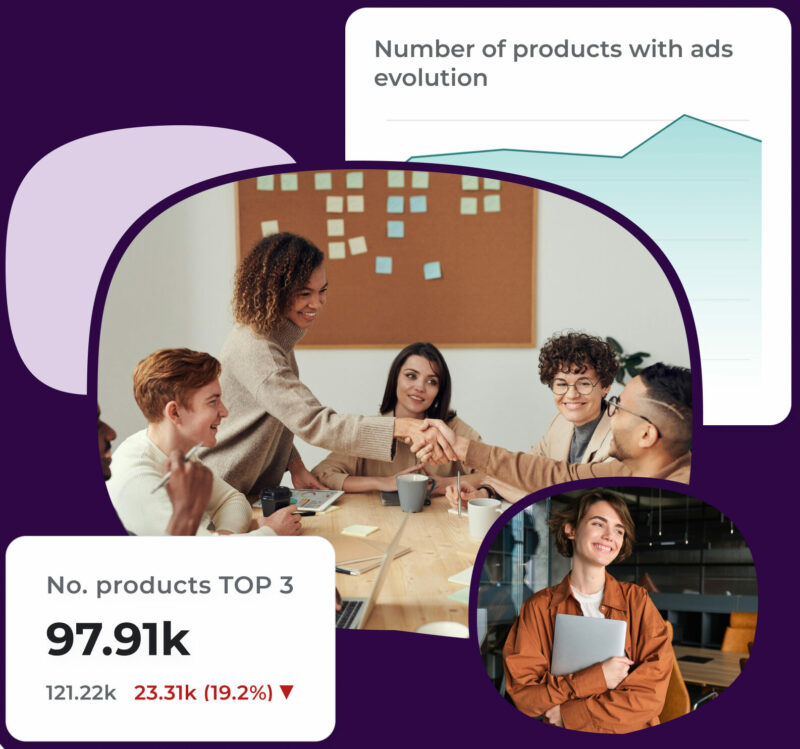



Monitor prices, promotions and channel conflicts on a daily basis and drive your e-commerce strategy with competitive insights
Monitor prices, promotions and your competitors in key marketplaces so you can react quickly to market changes.
Ensure regulatory compliance and content standards: avoid penalties, returns, or listing rejections.
Optimize your sales team’s time, save costs, and reduce channel conflicts.
Set up real-time alerts on price or stock changes from your competitors to enable instant solutions.

Optimise the presence of your products on the digital shelf
Monitor your positioning in categories and searches product by product to improve your performance. Master your Share of Shelf.
Make sure your product listings meet standards to improve visibility. Analyse A+ / Rich Media content to identify which versions convert best.
Track real-time stock levels and availability to prevent products from appearing as sold out or out of stock.
Review brand consistency across all digital retailers: control copy, visual branding, and highlighted attributes.
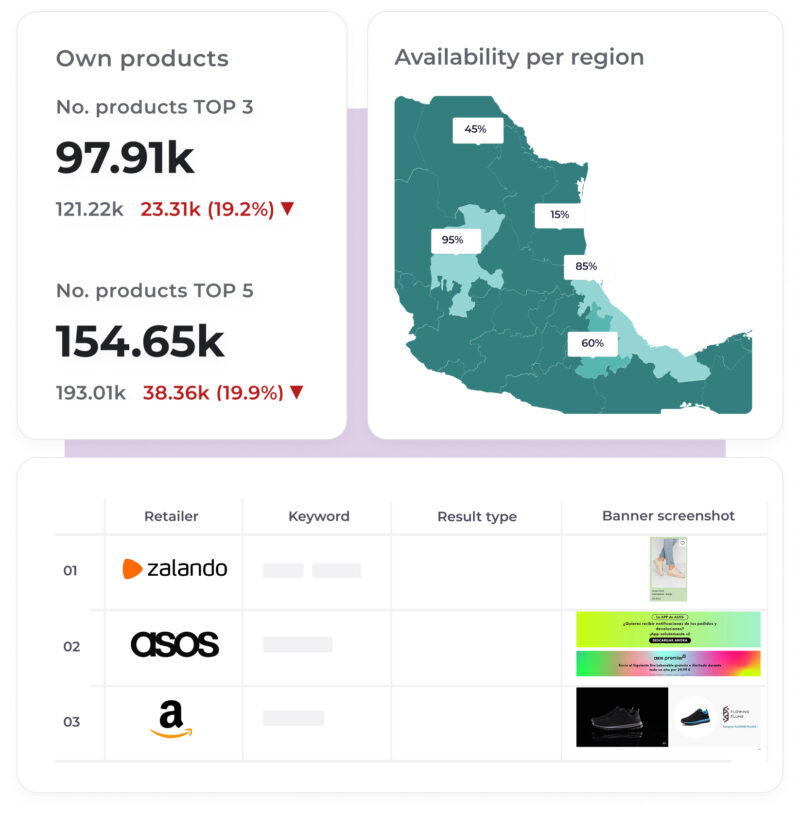
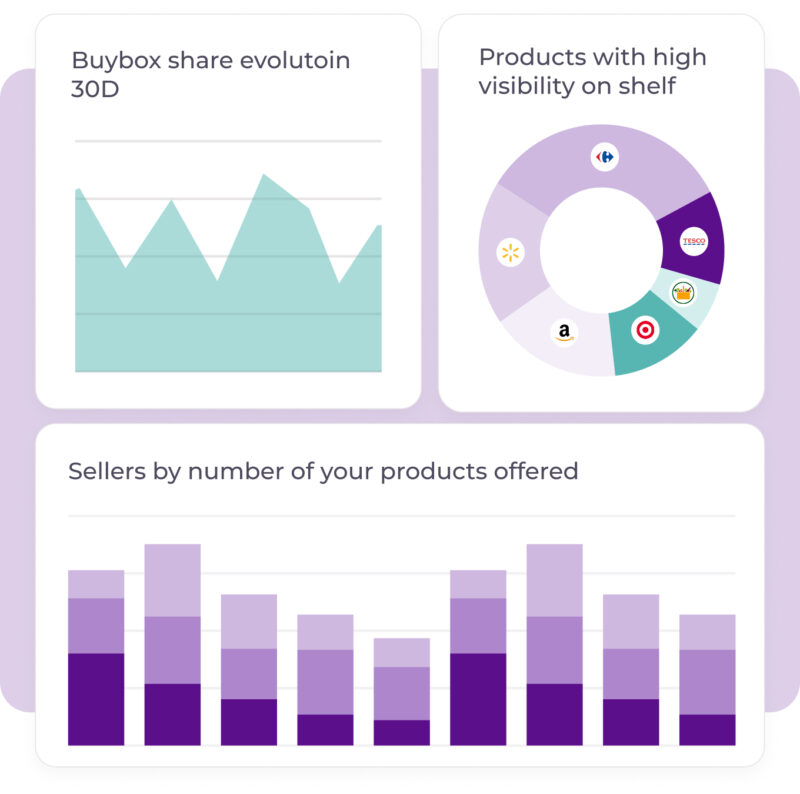
Check daily changes in the Buy Box and all of your sellers.
Track who is selling which product at any given time, both direct retailers and third party vendors
Boost your strategy in 1P/3P marketplaces with information on sell-out, positioning, and advertisements about your brand and your competitors.
Monitor Buy Boxes on marketplaces such as Amazon and daily fluctuations in sellers within them.
Avoid lost sales with stock and assortment information by store, and real-time alerts for your sales team.
Multiply your Retail Media ROI and monitor your competitors at the same time
Control the entire flow of your campaigns by centralising your performance data on our platform.
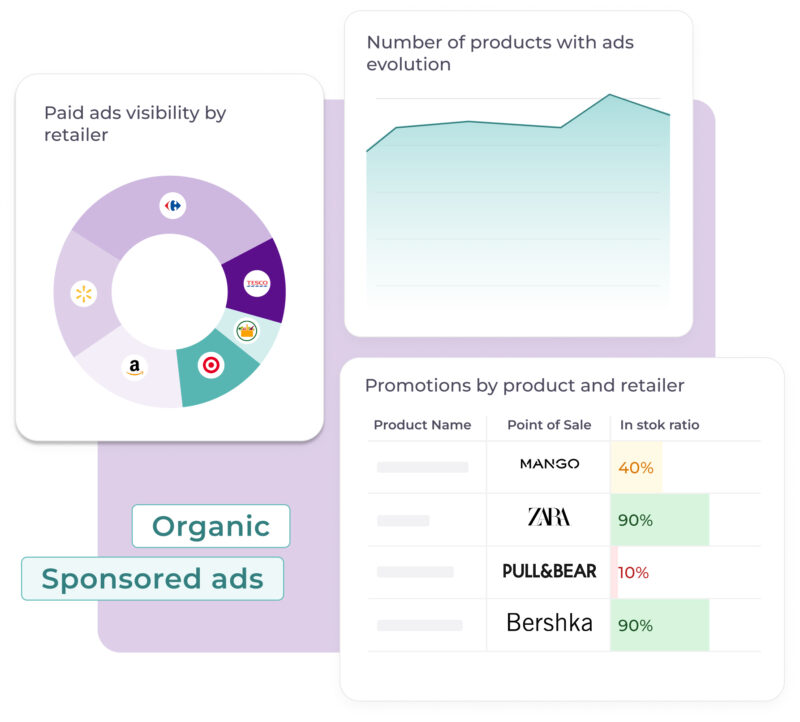
Analyse the Share of Voice of your adverts compared to the competition to optimise bids and creative content.
Monitor both your paid and organic positions, as well as your own and your competitors’, in real time.
Optimize and explain performance with what happens around your ads: prices, promotions and even out of stocks.